Countries
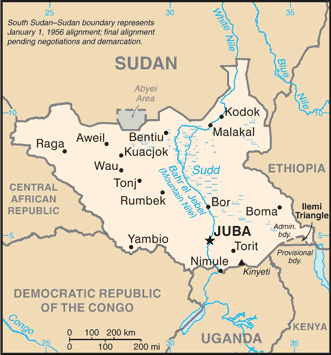
South Sudan

Key Economic Indicators
<strong>note:</strong> data in 2015 dollars
<strong>note:</strong> data in 2015 dollars
<b>note:</b> annual GDP % growth based on constant local currency
91.44%
12.37%
$4.629 billion (2023 est.)
86.6% of GDP (2016 est.)
$577.9 million
Economic Overview
low-income, oil-based Sahelian economy; extreme poverty and food insecurity; COVID-19 and ongoing violence threaten socioeconomic potential; environmentally fragile; ongoing land and property rights issues; natural resource rich but lacks infrastructure
All Economic Data
Agricultural products
milk, cassava, sorghum, goat milk, vegetables, fruits, groundnuts, sesame seeds, beef, maize (2023)
note:
<b>note:</b> top ten agricultural products based on tonnage
Budget
Expenditures:
$1.984 billion (2023 est.)
Note:
<b>note:</b> central government revenues and expenses (excluding grants/extrabudgetary units/social security funds) converted to US dollars at average official exchange rate for year indicated
Revenues:
$2.513 billion (2023 est.)
Currency
code:
SSP
name:
South Sudanese pound (SSP) [£]
Current account balance
$577.9 million
Current account balance 2021:
-$6.55 million (2021 est.)
Current account balance 2022:
-$596.748 million (2022 est.)
Current account balance 2023:
$577.9 million (2023 est.)
Note:
<b>note:</b> balance of payments - net trade and primary/secondary income in current dollars
Exchange rates
Currency:
South Sudanese pounds (SSP) per US dollar -
Exchange rates 2020:
165.907 (2020 est.)
Exchange rates 2021:
306.355 (2021 est.)
Exchange rates 2022:
534.511 (2022 est.)
Exchange rates 2023:
930.331 (2023 est.)
Exchange rates 2024:
2,163.104 (2024 est.)
Exports
Exports 2021:
$4.652 billion (2021 est.)
Exports 2022:
$5.811 billion (2022 est.)
Exports 2023:
$4.499 billion (2023 est.)
Note:
<b>note:</b> balance of payments - exports of goods and services in current dollars
Exports - commodities
crude petroleum, refined petroleum, forage crops, gold, scrap iron (2023)
note:
<b>note:</b> top five export commodities based on value in dollars
Exports - partners
China 51%, Singapore 29%, UAE 10%, Germany 4%, Uganda 3% (2023)
note:
<b>note:</b> top five export partners based on percentage share of exports
Foreign direct investment
net inflows:
$83.42 million
GDP - composition, by sector of origin
Agriculture:
10.4% (2015 est.)
Industry:
33.1% (2015 est.)
Note:
<b>note:</b> figures may not total 100% due to non-allocated consumption not captured in sector-reported data
Services:
56.6% (2015 est.)
GDP (official exchange rate)
$4.629 billion (2023 est.)
note:
<b>note:</b> data in current dollars at official exchange rate
Gini Index coefficient - distribution of family income
44.1 (2016)
Gini Index coefficient - distribution of family income 2016:
44 (2016 est.)
Note:
<b>note:</b> index (0-100) of income distribution; higher values represent greater inequality
Household income or consumption by percentage share
Highest 10%:
33% (2016 est.)
Lowest 10%:
1.8% (2016 est.)
Note:
<strong>note:</strong> % share of income accruing to lowest and highest 10% of population
Imports
Imports 2021:
$4.037 billion (2021 est.)
Imports 2022:
$6.402 billion (2022 est.)
Imports 2023:
$4.443 billion (2023 est.)
Note:
<b>note:</b> balance of payments - imports of goods and services in current dollars
Imports - commodities
garments, cement, other foods, iron bars, cereal flours (2023)
note:
<b>note:</b> top five import commodities based on value in dollars
Imports - partners
Uganda 33%, UAE 26%, Kenya 14%, China 10%, USA 3% (2023)
note:
<b>note:</b> top five import partners based on percentage share of imports
Industrial production growth rate
-36.8% (2015 est.)
note:
<b>note:</b> annual % change in industrial value added based on constant local currency
Inflation rate (consumer prices)
91.44%
Inflation rate (consumer prices) 2022:
-6.7% (2022 est.)
Inflation rate (consumer prices) 2023:
2.4% (2023 est.)
Inflation rate (consumer prices) 2024:
91.4% (2024 est.)
Note:
<b>note:</b> annual % change based on consumer prices
Labor force
5.091 million (2023 est.)
note:
<b>note:</b> number of people ages 15 or older who are employed or seeking work
total:
5.07 million persons
Labor force - by occupation
agriculture:
63.76%
industry:
1.67%
services:
34.57%
Population below poverty line
82.3% (2016 est.)
note:
<b>note:</b> % of population with income below national poverty line
Public debt
Public debt 2016:
86.6% of GDP (2016 est.)
Real GDP (purchasing power parity)
Note:
<strong>note:</strong> data in 2015 dollars
Real GDP (purchasing power parity) 2021:
$6.945 billion (2021 est.)
Real GDP (purchasing power parity) 2022:
$6.585 billion (2022 est.)
Real GDP (purchasing power parity) 2023:
$6.752 billion (2023 est.)
Real GDP growth rate
Note:
<b>note:</b> annual GDP % growth based on constant local currency
Real GDP growth rate 2015:
-10.8% (2015 est.)
Real GDP growth rate 2016:
-13.9% (2016 est.)
Real GDP growth rate 2017:
-5.2% (2017 est.)
Real GDP per capita
Note:
<strong>note:</strong> data in 2015 dollars
Real GDP per capita 2021:
$400 (2021 est.)
Real GDP per capita 2022:
$400 (2022 est.)
Real GDP per capita 2023:
$400 (2023 est.)
Remittances
$1.14 billion
Note:
<strong>note:</strong> personal transfers and compensation between resident and non-resident individuals/households/entities
Remittances 2013:
0% of GDP (2013 est.)
Remittances 2014:
0% of GDP (2014 est.)
Remittances 2015:
9.5% of GDP (2015 est.)
Reserves of foreign exchange and gold
$72.88 million
Note:
<b>note:</b> holdings of gold (year-end prices)/foreign exchange/special drawing rights in current dollars
Reserves of foreign exchange and gold 2021:
$341.932 million (2021 est.)
Reserves of foreign exchange and gold 2022:
$94.914 million (2022 est.)
Reserves of foreign exchange and gold 2023:
$72.881 million (2023 est.)
Unemployment rate
12.37%
Note:
<b>note:</b> % of labor force seeking employment
Unemployment rate 2021:
14.1% (2021 est.)
Unemployment rate 2022:
12.6% (2022 est.)
Unemployment rate 2023:
12.5% (2023 est.)
Youth unemployment rate (ages 15-24)
Female:
17.6% (2023 est.)
Male:
19.4% (2023 est.)
Note:
<b>note:</b> % of labor force ages 15-24 seeking employment
Total:
18.5% (2023 est.)
Economic Rankings
Inflation Rate
#8
Unemployment Rate
#24
Gini Index
#39
Exports
#137
Imports
#140
GDP (Nominal)
#162
Reserves
#165
GDP (PPP)
#169
GDP Growth Rate
#193
GDP per Capita
#193
Quick Facts
Agricultural products
milk, cassava, sorghum, goat milk, vegetables, fruits, groundnuts, sesame seeds, beef, maize (2023)
Labor force
5.091 million (2023 est.)
Exports - partners
China 51%, Singapore 29%, UAE 10%, Germany 4%, Uganda 3% (2023)
Imports - partners
Uganda 33%, UAE 26%, Kenya 14%, China 10%, USA 3% (2023)
Exchange rates
South Sudanese pounds (SSP) per US dollar -
Explore More
Our Partners
Trusted partner applications powering global data and insights