Countries
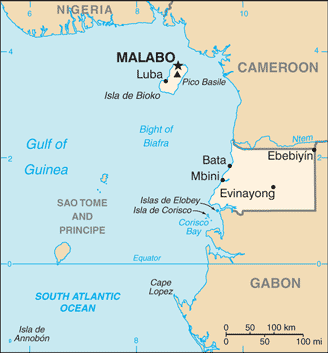
Equatorial Guinea

Key Economic Indicators
$33.25 billion
$17,567
0.91%
2.92%
8.34%
$12.766 billion (2024 est.)
43.3% of GDP (2016 est.)
Economic Overview
growing CEMAC economy and new OPEC member; large oil and gas reserves; targeting economic diversification and poverty reduction; still recovering from CEMAC crisis; improving public financial management; persistent poverty; hard-hit by COVID-19
All Economic Data
Agricultural products
sweet potatoes, cassava, plantains, oil palm fruit, root vegetables, bananas, coconuts, coffee, cocoa beans, chicken (2023)
note:
<b>note:</b> top ten agricultural products based on tonnage
Budget
Expenditures:
$2.051 billion (2022 est.)
Note:
<b>note:</b> central government revenues and expenses (excluding grants/extrabudgetary units/social security funds) converted to US dollars at average official exchange rate for year indicated
Revenues:
$3.62 billion (2022 est.)
Currency
code:
XAF
name:
Central African CFA franc (XAF) [Fr]
Exchange rates
Currency:
Cooperation Financiere en Afrique Centrale francs (XAF) per US dollar -
Exchange rates 2020:
575.586 (2020 est.)
Exchange rates 2021:
554.531 (2021 est.)
Exchange rates 2022:
623.76 (2022 est.)
Exchange rates 2023:
606.57 (2023 est.)
Exchange rates 2024:
606.345 (2024 est.)
Exports
$4.49 billion
Exports 2022:
$7.25 billion (2022 est.)
Exports 2023:
$4.516 billion (2023 est.)
Exports 2024:
$4.489 billion (2024 est.)
Note:
<strong>note: </strong>GDP expenditure basis - exports of goods and services in current dollars
Exports - commodities
crude petroleum, natural gas, alcohols, wood, scrap iron (2023)
note:
<b>note:</b> top five export commodities based on value in dollars
Exports - partners
China 27%, Netherlands 12%, Spain 10%, Italy 7%, Germany 6% (2023)
note:
<b>note:</b> top five export partners based on percentage share of exports
Foreign direct investment
net inflows:
$188.01 million
GDP - composition, by end use
Exports of goods and services:
35.2% (2024 est.)
Government consumption:
28.3% (2024 est.)
Household consumption:
52.9% (2024 est.)
Imports of goods and services:
-25.4% (2024 est.)
Investment in fixed capital:
9.1% (2024 est.)
Investment in inventories:
-0.1% (2024 est.)
Note:
<b>note:</b> figures may not total 100% due to rounding or gaps in data collection
GDP - composition, by sector of origin
Agriculture:
3.1% (2024 est.)
Industry:
45.8% (2024 est.)
Note:
<b>note:</b> figures may not total 100% due to non-allocated consumption not captured in sector-reported data
Services:
51.1% (2024 est.)
GDP (official exchange rate)
$12.766 billion (2024 est.)
note:
<b>note:</b> data in current dollars at official exchange rate
GDP per capita (nominal)
$6,745
Gini Index coefficient - distribution of family income
39 index
Gini Index coefficient - distribution of family income 2022:
38.5 (2022 est.)
Note:
<strong>note:</strong> index (0-100) of income distribution; higher values represent greater inequality
GNI (gross national income)
$8.96 billion
GNI per capita
$4,740
Gross domestic investment
9 % of GDP
Household income or consumption by percentage share
Highest 10%:
29.1% (2022 est.)
Lowest 10%:
2.6% (2022 est.)
Note:
<strong>note:</strong> % share of income accruing to lowest and highest 10% of population
Imports
$3.24 billion
Imports 2022:
$3.948 billion (2022 est.)
Imports 2023:
$3.065 billion (2023 est.)
Imports 2024:
$3.24 billion (2024 est.)
Note:
<strong>note: </strong>GDP expenditure basis - imports of goods and services in current dollars
Imports - commodities
ships, poultry, plastic products, beer, valves (2023)
note:
<b>note:</b> top five import commodities based on value in dollars
Imports - partners
China 20%, Spain 17%, USA 10%, Gabon 5%, UK 5% (2023)
note:
<b>note:</b> top five import partners based on percentage share of imports
Industrial production growth rate
0.8% (2024 est.)
note:
<b>note:</b> annual % change in industrial value added based on constant local currency
Industries
petroleum, natural gas, sawmilling
Inflation rate (consumer prices)
2.92%
Inflation rate (consumer prices) 2020:
4.8% (2020 est.)
Inflation rate (consumer prices) 2021:
-0.1% (2021 est.)
Inflation rate (consumer prices) 2022:
4.8% (2022 est.)
Note:
<b>note:</b> annual % change based on consumer prices
Labor force
715,000 (2024 est.)
note:
<b>note:</b> number of people ages 15 or older who are employed or seeking work
total:
737,977 persons
Labor force - by occupation
agriculture:
55.32%
industry:
9.93%
services:
34.75%
Population below poverty line
50.7%
Public debt
Public debt 2016:
43.3% of GDP (2016 est.)
Real GDP (purchasing power parity)
$33.25 billion
Note:
<b>note:</b> data in 2021 dollars
Real GDP (purchasing power parity) 2022:
$30.539 billion (2022 est.)
Real GDP (purchasing power parity) 2023:
$28.985 billion (2023 est.)
Real GDP (purchasing power parity) 2024:
$29.248 billion (2024 est.)
Real GDP growth rate
0.91%
Note:
<b>note:</b> annual GDP % growth based on constant local currency
Real GDP growth rate 2022:
3.2% (2022 est.)
Real GDP growth rate 2023:
-5.1% (2023 est.)
Real GDP growth rate 2024:
0.9% (2024 est.)
Real GDP per capita
$17,567
Note:
<b>note:</b> data in 2021 dollars
Real GDP per capita 2022:
$16,900 (2022 est.)
Real GDP per capita 2023:
$15,700 (2023 est.)
Real GDP per capita 2024:
$15,500 (2024 est.)
Remittances
Note:
<strong>note:</strong> personal transfers and compensation between resident and non-resident individuals/households/entities
Remittances 2021:
0% of GDP (2021 est.)
Remittances 2022:
0% of GDP (2022 est.)
Remittances 2023:
0% of GDP (2023 est.)
Reserves of foreign exchange and gold
$1.54 billion
Note:
<b>note:</b> holdings of gold (year-end prices)/foreign exchange/special drawing rights in current dollars
Reserves of foreign exchange and gold 2021:
$44.271 million (2021 est.)
Reserves of foreign exchange and gold 2022:
$1.458 billion (2022 est.)
Reserves of foreign exchange and gold 2023:
$1.538 billion (2023 est.)
Revenue (excl grants)
26 % of GDP
Tax revenue
7 % of GDP
Taxes and other revenues
6.6% (of GDP) (2022 est.)
note:
<b>note:</b> central government tax revenue as a % of GDP
Unemployment rate
8.34%
Note:
<b>note:</b> % of labor force seeking employment
Unemployment rate 2022:
8.5% (2022 est.)
Unemployment rate 2023:
8.4% (2023 est.)
Unemployment rate 2024:
7.9% (2024 est.)
Youth unemployment rate (ages 15-24)
Female:
15.7% (2024 est.)
Male:
13.9% (2024 est.)
Note:
<b>note:</b> % of labor force ages 15-24 seeking employment
Total:
14.7% (2024 est.)
World Bank Indicators
Broad Money
13.88 (2023)
Current Account Balance (US$)
-344,039,026.28 (1996)
Exchange Rate
606 (2024)
Exports (US$)
$4.49B (2024)
FDI Net Inflows (US$)
1.47 (2024)
GDP Growth (%)
0.91 (2024)
GDP Per Capita
6,745 (2024)
GDP (Current US$)
$12.77B (2024)
Gini Index
38.50 (2022)
Govt Expenditure
11.05 (2022)
Govt Revenue
26.45 (2022)
Imports (US$)
$3.24B (2024)
Inflation Rate (%)
2.92 (2024)
Population
$1.89M (2024)
Reserves
$1.08B (2024)
Trade Pct Gdp
60.54 (2024)
Unemployment Rate (%)
8.34 (2025)
Youth Unemployment
15.74 (2025)
Economic Rankings
Unemployment Rate
#56
Gini Index
#78
GDP per Capita
#102
Exports
#128
Reserves
#133
GDP (PPP)
#145
GDP (Nominal)
#145
GDP Growth Rate
#150
Imports
#153
Inflation Rate
#166
Quick Facts
Industries
petroleum, natural gas, sawmilling
Agricultural products
sweet potatoes, cassava, plantains, oil palm fruit, root vegetables, bananas, coconuts, coffee, cocoa beans, chicken (2023)
Labor force
715,000 (2024 est.)
Exports - partners
China 27%, Netherlands 12%, Spain 10%, Italy 7%, Germany 6% (2023)
Imports - partners
China 20%, Spain 17%, USA 10%, Gabon 5%, UK 5% (2023)
Exchange rates
Cooperation Financiere en Afrique Centrale francs (XAF) per US dollar -
Explore More
Our Partners
Trusted partner applications powering global data and insights