Countries
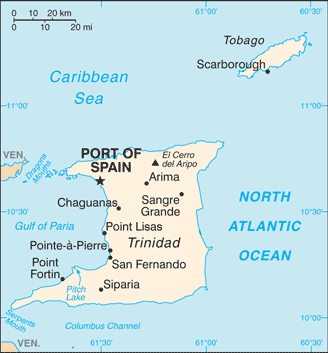
Trinidad and Tobago

Key Economic Indicators
$49.71 billion
$36,329
2.51%
0.53%
3.33%
$26.429 billion (2024 est.)
37% of GDP (2016 est.)
$645.48 million
Economic Overview
high-income Caribbean economy; major hydrocarbon exporter; key tourism and finance sectors; high inflation and growing public debt; long foreign currency access delays; large foreign reserves and sovereign wealth fund
All Economic Data
Agricultural products
chicken, fruits, coconuts, citrus fruits, maize, oranges, plantains, eggs, taro, mangoes/guavas (2023)
note:
<b>note:</b> top ten agricultural products based on tonnage
Budget
Expenditures:
$7.822 billion (2019 est.)
Note:
<b>note:</b> central government revenues (excluding grants) and expenses converted to US dollars at average official exchange rate for year indicated
Revenues:
$5.698 billion (2019 est.)
Currency
code:
TTD
name:
Trinidad and Tobago dollar (TTD) [$]
Current account balance
$645.48 million
Current account balance 2022:
$4.967 billion (2022 est.)
Current account balance 2023:
$2.948 billion (2023 est.)
Current account balance 2024:
$1.117 billion (2024 est.)
Note:
<b>note:</b> balance of payments - net trade and primary/secondary income in current dollars
Exchange rates
Currency:
Trinidad and Tobago dollars (TTD) per US dollar -
Exchange rates 2020:
6.751 (2020 est.)
Exchange rates 2021:
6.759 (2021 est.)
Exchange rates 2022:
6.754 (2022 est.)
Exchange rates 2023:
6.75 (2023 est.)
Exchange rates 2024:
6.75 (2024 est.)
Exports
Exports 2022:
$17.584 billion (2022 est.)
Exports 2023:
$11.545 billion (2023 est.)
Exports 2024:
$11.087 billion (2024 est.)
Note:
<b>note:</b> balance of payments - exports of goods and services in current dollars
Exports - commodities
natural gas, alcohols, ammonia, crude petroleum, iron reductions (2023)
note:
<b>note:</b> top five export commodities based on value in dollars
Exports - partners
USA 28%, China 7%, Guyana 5%, Chile 5%, Netherlands 5% (2023)
note:
<b>note:</b> top five export partners based on percentage share of exports
Foreign direct investment
net inflows:
$-453,157,052
GDP - composition, by end use
Exports of goods and services:
45.4% (2017 est.)
Government consumption:
16.4% (2017 est.)
Household consumption:
78.9% (2017 est.)
Imports of goods and services:
-48.7% (2017 est.)
Investment in fixed capital:
19.8% (2021 est.)
Investment in inventories:
0% (2021 est.)
GDP - composition, by sector of origin
Agriculture:
0.8% (2023 est.)
Industry:
35% (2023 est.)
Note:
<b>note:</b> figures may not total 100% due to non-allocated consumption not captured in sector-reported data
Services:
59.9% (2023 est.)
GDP (official exchange rate)
$26.429 billion (2024 est.)
note:
<b>note:</b> data in current dollars at official exchange rate
GDP per capita (nominal)
$18,733
Gini Index coefficient - distribution of family income
40.3 (1992)
GNI (gross national income)
$25.81 billion
GNI per capita
$19,740
Gross domestic investment
19 % of GDP
Imports
Imports 2022:
$10.968 billion (2022 est.)
Imports 2023:
$9.219 billion (2023 est.)
Imports 2024:
$10.19 billion (2024 est.)
Note:
<b>note:</b> balance of payments - imports of goods and services in current dollars
Imports - commodities
railway cargo containers, refined petroleum, cars, iron ore, excavation machinery (2023)
note:
<b>note:</b> top five import commodities based on value in dollars
Imports - partners
USA 29%, Guyana 27%, China 8%, Brazil 4%, Canada 3% (2023)
note:
<b>note:</b> top five import partners based on percentage share of imports
Industrial production growth rate
-4.7% (2023 est.)
note:
<b>note:</b> annual % change in industrial value added based on constant local currency
Industries
petroleum and petroleum products, liquefied natural gas, methanol, ammonia, urea, steel products, beverages, food processing, cement, cotton textiles
Inflation rate (consumer prices)
0.53%
Inflation rate (consumer prices) 2022:
5.8% (2022 est.)
Inflation rate (consumer prices) 2023:
4.6% (2023 est.)
Inflation rate (consumer prices) 2024:
0.5% (2024 est.)
Note:
<b>note:</b> annual % change based on consumer prices
Labor force
649,900 (2024 est.)
note:
<b>note:</b> number of people ages 15 or older who are employed or seeking work
total:
653,446 persons
Labor force - by occupation
agriculture:
4.49%
industry:
24.18%
services:
71.32%
Public debt
Public debt 2016:
37% of GDP (2016 est.)
Real GDP (purchasing power parity)
$49.71 billion
Note:
<b>note:</b> data in 2021 dollars
Real GDP (purchasing power parity) 2022:
$42.058 billion (2022 est.)
Real GDP (purchasing power parity) 2023:
$42.658 billion (2023 est.)
Real GDP (purchasing power parity) 2024:
$43.362 billion (2024 est.)
Real GDP growth rate
2.51%
Note:
<b>note:</b> annual GDP % growth based on constant local currency
Real GDP growth rate 2022:
1.1% (2022 est.)
Real GDP growth rate 2023:
1.4% (2023 est.)
Real GDP growth rate 2024:
1.7% (2024 est.)
Real GDP per capita
$36,329
Note:
<b>note:</b> data in 2021 dollars
Real GDP per capita 2022:
$30,800 (2022 est.)
Real GDP per capita 2023:
$31,200 (2023 est.)
Real GDP per capita 2024:
$31,700 (2024 est.)
Remittances
$199.17 million
Note:
<b>note:</b> personal transfers and compensation between resident and non-resident individuals/households/entities
Remittances 2022:
0.7% of GDP (2022 est.)
Remittances 2023:
0.8% of GDP (2023 est.)
Remittances 2024:
0.8% of GDP (2024 est.)
Reserves of foreign exchange and gold
$5.6 billion
Note:
<b>note:</b> holdings of gold (year-end prices)/foreign exchange/special drawing rights in current dollars
Reserves of foreign exchange and gold 2022:
$6.832 billion (2022 est.)
Reserves of foreign exchange and gold 2023:
$6.256 billion (2023 est.)
Reserves of foreign exchange and gold 2024:
$5.601 billion (2024 est.)
Taxes and other revenues
16.7% (of GDP) (2019 est.)
note:
<b>note:</b> central government tax revenue as a % of GDP
Unemployment rate
3.33%
Note:
<b>note:</b> % of labor force seeking employment
Unemployment rate 2022:
4.4% (2022 est.)
Unemployment rate 2023:
4.3% (2023 est.)
Unemployment rate 2024:
4.6% (2024 est.)
Youth unemployment rate (ages 15-24)
Female:
12% (2024 est.)
Male:
10.3% (2024 est.)
Note:
<b>note:</b> % of labor force ages 15-24 seeking employment
Total:
11.1% (2024 est.)
World Bank Indicators
Broad Money
72.54 (2024)
Currency
Central African CFA franc (XAF) Fr (2025)
Current Account Balance (US$)
$645.48M (2024)
Exchange Rate
6.75 (2024)
Exports (US$)
$5.81B (2024)
External Debt
$3.35B (2024)
FDI Net Inflows (US$)
-1.77 (2024)
GDP Growth (%)
2.51 (2024)
Gdp Nominal
$19.52B (2024)
GDP Per Capita
18,733 (2024)
GDP (Current US$)
$25.63B (2024)
Gini Index
40.20 (1992)
Government Debt (% GDP)
15.93 (2007)
Govt Expenditure
33.32 (2019)
Govt Revenue
24.26 (2019)
Imports (US$)
$3.53B (2024)
Inflation Rate (%)
0.53 (2024)
Inflation Rate
8.90 (2024)
Languages
Arabic, French (2025)
Population
$1.37M (2024)
Reserves
$5.60B (2024)
Unemployment Rate (%)
3.33 (2025)
Unemployment Rate
1.05 (2024)
Youth Unemployment
8.22 (2025)
Economic Rankings
GDP per Capita
#59
Gini Index
#65
Reserves
#89
Exports
#95
GDP (Nominal)
#112
Unemployment Rate
#116
Imports
#118
GDP (PPP)
#132
Inflation Rate
#149
GDP Growth Rate
#170
Quick Facts
Industries
petroleum and petroleum products, liquefied natural gas, methanol, ammonia, urea, steel products, beverages, food processing, cement, cotton textiles
Agricultural products
chicken, fruits, coconuts, citrus fruits, maize, oranges, plantains, eggs, taro, mangoes/guavas (2023)
Labor force
649,900 (2024 est.)
Exports - partners
USA 28%, China 7%, Guyana 5%, Chile 5%, Netherlands 5% (2023)
Imports - partners
USA 29%, Guyana 27%, China 8%, Brazil 4%, Canada 3% (2023)
Exchange rates
Trinidad and Tobago dollars (TTD) per US dollar -
Explore More
Our Partners
Trusted partner applications powering global data and insights