Countries
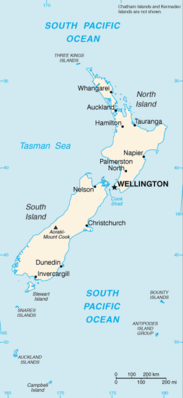
New Zealand

Key Economic Indicators
$293.73 billion
$55,551
1.29%
2.92%
5.08%
$260.236 billion (2024 est.)
54 % of GDP
$-12,106,086,040
Economic Overview
<p>high-income, globally integrated Pacific island economy; strong agriculture, manufacturing, and tourism sectors; reliant on Chinese market for exports; recovery trajectory following deep post-pandemic recession; challenges of fiscal deficits, below-average productivity, cost of living, and drop in net migration</p>
All Economic Data
Agricultural products
milk, beef, kiwifruit, apples, grapes, lamb/mutton, potatoes, wheat, barley, chicken (2023)
note:
<b>note:</b> top ten agricultural products based on tonnage
Average household expenditures
On alcohol and tobacco:
4.7% of household expenditures (2023 est.)
On food:
12.8% of household expenditures (2023 est.)
Budget
Expenditures:
$91.782 billion (2022 est.)
Note:
<b>note:</b> central government revenues (excluding grants) and expenditures converted to US dollars at average official exchange rate for year indicated
Revenues:
$83.167 billion (2022 est.)
Currency
code:
NZD
name:
New Zealand dollar (NZD) [$]
Current account balance
$-12,106,086,040
Current account balance 2022:
-$21.627 billion (2022 est.)
Current account balance 2023:
-$17.065 billion (2023 est.)
Current account balance 2024:
-$15.978 billion (2024 est.)
Note:
<b>note:</b> balance of payments - net trade and primary/secondary income in current dollars
Exchange rates
Currency:
New Zealand dollars (NZD) per US dollar -
Exchange rates 2020:
1.542 (2020 est.)
Exchange rates 2021:
1.414 (2021 est.)
Exchange rates 2022:
1.577 (2022 est.)
Exchange rates 2023:
1.628 (2023 est.)
Exchange rates 2024:
1.652 (2024 est.)
Exports
$64.54 billion
Exports 2022:
$57.485 billion (2022 est.)
Exports 2023:
$59.029 billion (2023 est.)
Exports 2024:
$61.799 billion (2024 est.)
Note:
<b>note:</b> balance of payments - exports of goods and services in current dollars
Exports - commodities
milk, wood, beef, butter, sheep and goat meat (2023)
note:
<b>note:</b> top five export commodities based on value in dollars
Exports - partners
China 28%, USA 12%, Australia 12%, Japan 6%, S. Korea 3% (2023)
note:
<b>note:</b> top five export partners based on percentage share of exports
Foreign direct investment
net inflows:
$1.76 billion
GDP - composition, by end use
Exports of goods and services:
24% (2022 est.)
Government consumption:
20.9% (2022 est.)
Household consumption:
57.5% (2022 est.)
Imports of goods and services:
-29.4% (2022 est.)
Investment in fixed capital:
25.4% (2022 est.)
Investment in inventories:
0.9% (2022 est.)
Note:
<b>note:</b> figures may not total 100% due to rounding or gaps in data collection
GDP - composition, by sector of origin
Agriculture:
4.6% (2022 est.)
Industry:
19.6% (2022 est.)
Note:
<b>note:</b> figures may not total 100% due to non-allocated consumption not captured in sector-reported data
Services:
67.4% (2022 est.)
GDP (official exchange rate)
$260.236 billion (2024 est.)
note:
<b>note:</b> data in current dollars at official exchange rate
GDP per capita (nominal)
$49,205
GNI (gross national income)
$253.26 billion
GNI per capita
$47,580
Gross domestic investment
23 % of GDP
Imports
$68.74 billion
Imports 2022:
$71.35 billion (2022 est.)
Imports 2023:
$68.412 billion (2023 est.)
Imports 2024:
$67.998 billion (2024 est.)
Note:
<b>note:</b> balance of payments - imports of goods and services in current dollars
Imports - commodities
refined petroleum, cars, gas turbines, broadcasting equipment, trucks (2023)
note:
<b>note:</b> top five import commodities based on value in dollars
Imports - partners
China 20%, Australia 11%, USA 9%, S. Korea 7%, Japan 7% (2023)
note:
<b>note:</b> top five import partners based on percentage share of imports
Industrial production growth rate
-1% (2023 est.)
note:
<b>note:</b> annual % change in industrial value added based on constant local currency
Industries
agriculture, forestry, fishing, logs and wood articles, manufacturing, mining, construction, financial services, real estate services, tourism
Inflation rate (consumer prices)
2.92%
Inflation rate (consumer prices) 2022:
7.2% (2022 est.)
Inflation rate (consumer prices) 2023:
5.7% (2023 est.)
Inflation rate (consumer prices) 2024:
2.9% (2024 est.)
Note:
<b>note:</b> annual % change based on consumer prices
Labor force
3.124 million (2024 est.)
note:
<b>note:</b> number of people ages 15 or older who are employed or seeking work
total:
3.08 million persons
Labor force - by occupation
agriculture:
5.42%
industry:
19.94%
services:
74.64%
Public debt
54 % of GDP
Note:
<b>note:</b> central government debt as a % of GDP
Public debt 2022:
54% of GDP (2022 est.)
Real GDP (purchasing power parity)
$293.73 billion
Note:
<b>note:</b> data in 2021 dollars
Real GDP (purchasing power parity) 2022:
$253.903 billion (2022 est.)
Real GDP (purchasing power parity) 2023:
$257.443 billion (2023 est.)
Real GDP (purchasing power parity) 2024:
$257.117 billion (2024 est.)
Real GDP growth rate
1.29%
Note:
<b>note:</b> annual GDP % growth based on constant local currency
Real GDP growth rate 2022:
3.5% (2022 est.)
Real GDP growth rate 2023:
1.4% (2023 est.)
Real GDP growth rate 2024:
-0.1% (2024 est.)
Real GDP per capita
$55,551
Note:
<b>note:</b> data in 2021 dollars
Real GDP per capita 2022:
$49,600 (2022 est.)
Real GDP per capita 2023:
$49,100 (2023 est.)
Real GDP per capita 2024:
$48,200 (2024 est.)
Remittances
$598.19 million
Note:
<b>note:</b> personal transfers and compensation between resident and non-resident individuals/households/entities
Remittances 2021:
0.3% of GDP (2021 est.)
Remittances 2022:
0.2% of GDP (2022 est.)
Remittances 2023:
0.3% of GDP (2023 est.)
Reserves of foreign exchange and gold
$22.07 billion
Note:
<b>note:</b> holdings of gold (year-end prices)/foreign exchange/special drawing rights in current dollars
Reserves of foreign exchange and gold 2022:
$14.4 billion (2022 est.)
Reserves of foreign exchange and gold 2023:
$15.487 billion (2023 est.)
Reserves of foreign exchange and gold 2024:
$22.065 billion (2024 est.)
Revenue (excl grants)
35 % of GDP
Tax revenue
31 % of GDP
Taxes and other revenues
29.6% (of GDP) (2022 est.)
note:
<b>note:</b> central government tax revenue as a % of GDP
Unemployment rate
5.08%
Note:
<b>note:</b> % of labor force seeking employment
Unemployment rate 2022:
3.3% (2022 est.)
Unemployment rate 2023:
3.8% (2023 est.)
Unemployment rate 2024:
4.9% (2024 est.)
Youth unemployment rate (ages 15-24)
Female:
14% (2024 est.)
Male:
14.6% (2024 est.)
Note:
<b>note:</b> % of labor force ages 15-24 seeking employment
Total:
14.3% (2024 est.)
World Bank Indicators
Currency
New Zealand dollar (NZD) $ (2025)
Languages
English, Mori, New Zealand Sign Language (2025)
Economic Rankings
GDP per Capita
#37
GDP (Nominal)
#51
Imports
#57
Exports
#59
Reserves
#61
GDP (PPP)
#65
Unemployment Rate
#102
Inflation Rate
#121
GDP Growth Rate
#143
Quick Facts
Industries
agriculture, forestry, fishing, logs and wood articles, manufacturing, mining, construction, financial services, real estate services, tourism
Agricultural products
milk, beef, kiwifruit, apples, grapes, lamb/mutton, potatoes, wheat, barley, chicken (2023)
Labor force
3.124 million (2024 est.)
Exports - partners
China 28%, USA 12%, Australia 12%, Japan 6%, S. Korea 3% (2023)
Imports - partners
China 20%, Australia 11%, USA 9%, S. Korea 7%, Japan 7% (2023)
Exchange rates
New Zealand dollars (NZD) per US dollar -
Explore More
Our Partners
Trusted partner applications powering global data and insights