Countries
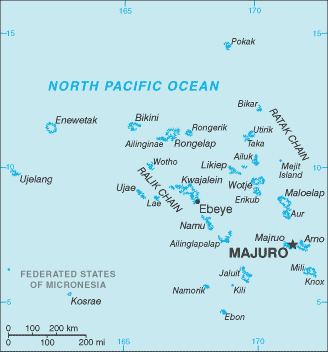
Marshall Islands

Key Economic Indicators
$307.69 million
$8,195
2.5%
-0.7% (2020 est.)
$280.358 million (2024 est.)
<b>note:</b> central government debt as a % of GDP
$76.26 million
Economic Overview
upper middle-income Pacific island economy; US aid reliance; large public sector; coconut oil production as diesel fuel substitute; growing offshore banking locale; fishing rights seller; import-dependent
All Economic Data
Agricultural products
coconuts (2023)
note:
<b>note:</b> top ten agricultural products based on tonnage
Budget
Expenditures:
$159.095 million (2020 est.)
Note:
<b>note:</b> central government revenues and expenses (excluding grants/extrabudgetary units/social security funds) converted to US dollars at average official exchange rate for year indicated
Revenues:
$171.267 million (2020 est.)
Currency
code:
USD
name:
United States dollar (USD) [$]
Current account balance
$76.26 million
Current account balance 2019:
$86.133 million (2019 est.)
Current account balance 2020:
$90.281 million (2020 est.)
Current account balance 2021:
$76.263 million (2021 est.)
Note:
<b>note:</b> balance of payments - net trade and primary/secondary income in current dollars
Exchange rates
<p>the US dollar is used</p>
Exports
$122.03 million
Exports 2019:
$91.394 million (2019 est.)
Exports 2020:
$88.042 million (2020 est.)
Exports 2021:
$130.016 million (2021 est.)
Note:
<b>note:</b> balance of payments - exports of goods and services in current dollars
Exports - commodities
ships, refined petroleum, fish, natural gas, stone processing machines (2023)
note:
<b>note:</b> top five export commodities based on value in dollars
Exports - partners
UK 16%, Germany 13%, Denmark 10%, Ghana 9%, Cyprus 9% (2023)
note:
<b>note:</b> top five export partners based on percentage share of exports
Foreign direct investment
net inflows:
$1.7 million
GDP - composition, by end use
Exports of goods and services:
38.9% (2023 est.)
Government consumption:
53.5% (2023 est.)
Household consumption:
70.7% (2023 est.)
Imports of goods and services:
-71.2% (2023 est.)
Investment in fixed capital:
20.2% (2023 est.)
Investment in inventories:
-0.5% (2023 est.)
Note:
<b>note:</b> figures may not total 100% due to rounding or gaps in data collection
GDP - composition, by sector of origin
Agriculture:
19.5% (2023 est.)
Industry:
11.1% (2023 est.)
Note:
<b>note:</b> figures may not total 100% due to non-allocated consumption not captured in sector-reported data
Services:
70.5% (2023 est.)
GDP (official exchange rate)
$280.358 million (2024 est.)
note:
<b>note:</b> data in current dollars at official exchange rate
GDP per capita (nominal)
$7,726
Gini Index coefficient - distribution of family income
Gini Index coefficient - distribution of family income 2019:
35.5 (2019 est.)
Note:
<b>note:</b> index (0-100) of income distribution; higher values represent greater inequality
GNI (gross national income)
$342.68 million
GNI per capita
$8,500
Gross domestic investment
21 % of GDP
Household income or consumption by percentage share
Highest 10%:
27.5% (2019 est.)
Lowest 10%:
2.8% (2019 est.)
Note:
<strong>note:</strong> % share of income accruing to lowest and highest 10% of population
Imports
$237.15 million
Imports 2019:
$129.682 million (2019 est.)
Imports 2020:
$132.845 million (2020 est.)
Imports 2021:
$206.025 million (2021 est.)
Note:
<b>note:</b> balance of payments - imports of goods and services in current dollars
Imports - commodities
ships, refined petroleum, additive manufacturing machines, iron structures, crude petroleum (2023)
note:
<b>note:</b> top five import commodities based on value in dollars
Imports - partners
China 47%, Japan 15%, Germany 5%, Brazil 4%, Cyprus 4% (2023)
note:
<b>note:</b> top five import partners based on percentage share of imports
Industrial production growth rate
-2.8% (2023 est.)
note:
<strong>note:</strong> annual % change in industrial value added based on constant local currency
Industries
copra, tuna processing, tourism, craft items (from seashells, wood, and pearls)
Inflation rate (consumer prices)
Inflation rate (consumer prices) 2020:
-0.7% (2020 est.)
Inflation rate (consumer prices) 2021:
2.6% (2021 est.)
Inflation rate (consumer prices) 2022:
6.2% (2022 est.)
Note:
<strong>note:</strong> annual % change based on consumer prices
Population below poverty line
7.2% (2019 est.)
note:
<b>note:</b> % of population with income below national poverty line
Public debt
Note:
<b>note:</b> central government debt as a % of GDP
Public debt 2019:
41.6% of GDP (2019 est.)
Real GDP (purchasing power parity)
$307.69 million
Note:
<b>note:</b> data in 2021 dollars
Real GDP (purchasing power parity) 2022:
$274.3 million (2022 est.)
Real GDP (purchasing power parity) 2023:
$263.507 million (2023 est.)
Real GDP (purchasing power parity) 2024:
$270.809 million (2024 est.)
Real GDP growth rate
2.5%
Note:
<b>note:</b> annual GDP % growth based on constant local currency
Real GDP growth rate 2022:
-1.1% (2022 est.)
Real GDP growth rate 2023:
-3.9% (2023 est.)
Real GDP growth rate 2024:
2.8% (2024 est.)
Real GDP per capita
$8,195
Note:
<b>note:</b> data in 2021 dollars
Real GDP per capita 2022:
$6,800 (2022 est.)
Real GDP per capita 2023:
$6,800 (2023 est.)
Real GDP per capita 2024:
$7,200 (2024 est.)
Remittances
$34.45 million
Note:
<b>note:</b> personal transfers and compensation between resident and non-resident individuals/households/entities
Remittances 2021:
13.3% of GDP (2021 est.)
Remittances 2022:
13.6% of GDP (2022 est.)
Remittances 2023:
13.3% of GDP (2023 est.)
Taxes and other revenues
17.2% (of GDP) (2020 est.)
note:
<b>note:</b> central government tax revenue as a % of GDP
Economic Rankings
Gini Index
#104
GDP per Capita
#135
Inflation Rate
#138
GDP Growth Rate
#159
Exports
#186
Imports
#188
GDP (Nominal)
#193
GDP (PPP)
#193
Quick Facts
Industries
copra, tuna processing, tourism, craft items (from seashells, wood, and pearls)
Agricultural products
coconuts (2023)
Exports - partners
UK 16%, Germany 13%, Denmark 10%, Ghana 9%, Cyprus 9% (2023)
Imports - partners
China 47%, Japan 15%, Germany 5%, Brazil 4%, Cyprus 4% (2023)
Exchange rates
<p>the US dollar is used</p>
Explore More
Our Partners
Trusted partner applications powering global data and insights