Countries
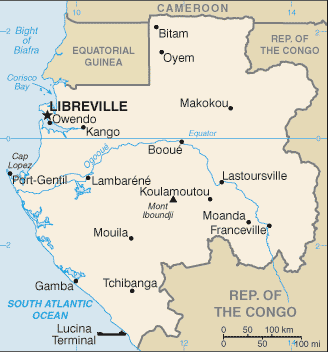
Gabon

Key Economic Indicators
$54.61 billion
$21,510
3.39%
1.17%
20.15%
$20.867 billion (2024 est.)
64.2% of GDP (2016 est.)
$1.463 billion (2013 est.)
Economic Overview
natural-resource-rich, upper-middle-income, Central African economy; significant reliance on oil and mineral exports; highly urbanized population; high levels of poverty and unemployment; uncertainty on institutional and development reform progress following 2023 military coup
All Economic Data
Agricultural products
oil palm fruit, plantains, cassava, sugarcane, yams, taro, vegetables, maize, groundnuts, game meat (2023)
note:
<b>note:</b> top ten agricultural products based on tonnage
Budget
Expenditures:
$3.226 billion (2021 est.)
Note:
<b>note:</b> central government revenues and expenses (excluding grants/extrabudgetary units/social security funds) converted to US dollars at average official exchange rate for year indicated
Revenues:
$2.939 billion (2021 est.)
Currency
code:
XAF
name:
Central African CFA franc (XAF) [Fr]
Current account balance
Current account balance 2013:
$1.463 billion (2013 est.)
Current account balance 2014:
$1.112 billion (2014 est.)
Current account balance 2015:
$140.996 million (2015 est.)
Note:
<strong>note:</strong> balance of payments - net trade and primary/secondary income in current dollars
Debt - external
$6.82 billion
Debt - external 2023:
$6.442 billion (2023 est.)
Note:
<b>note:</b> present value of external debt in current US dollars
Exchange rates
Currency:
Coopération Financière en Afrique Centrale francs (XAF) per US dollar -
Exchange rates 2020:
575.586 (2020 est.)
Exchange rates 2021:
554.531 (2021 est.)
Exchange rates 2022:
623.76 (2022 est.)
Exchange rates 2023:
606.57 (2023 est.)
Exchange rates 2024:
606.345 (2024 est.)
Exports
$13.49 billion
Exports 2022:
$13.814 billion (2022 est.)
Exports 2023:
$12.869 billion (2023 est.)
Exports 2024:
$13.622 billion (2024 est.)
Note:
<strong>note:</strong> GDP expenditure basis - exports of goods and services in current dollars
Exports - commodities
crude petroleum, ships, manganese ore, refined petroleum, wood (2023)
note:
<b>note:</b> top five export commodities based on value in dollars
Exports - partners
China 26%, Indonesia 8%, Spain 7%, Israel 6%, Congo, Republic of the 5% (2023)
note:
<b>note:</b> top five export partners based on percentage share of exports
Foreign direct investment
net inflows:
$1.14 billion
GDP - composition, by end use
Exports of goods and services:
65.3% (2024 est.)
Government consumption:
12.2% (2024 est.)
Household consumption:
33.7% (2024 est.)
Imports of goods and services:
-29.2% (2024 est.)
Investment in fixed capital:
18.1% (2024 est.)
Investment in inventories:
0% (2024 est.)
Note:
<strong>note:</strong> figures may not total 100% due to rounding or gaps in data collection
GDP - composition, by sector of origin
Agriculture:
6.2% (2024 est.)
Industry:
50.9% (2024 est.)
Note:
<b>note:</b> figures may not total 100% due to non-allocated consumption not captured in sector-reported data
Services:
37.5% (2024 est.)
GDP (official exchange rate)
$20.867 billion (2024 est.)
note:
<b>note:</b> data in current dollars at official exchange rate
GDP per capita (nominal)
$8,230
Gini Index coefficient - distribution of family income
38 (2017)
Gini Index coefficient - distribution of family income 2017:
38 (2017 est.)
Note:
<b>note:</b> index (0-100) of income distribution; higher values represent greater inequality
GNI (gross national income)
$19.82 billion
GNI per capita
$7,790
Gross domestic investment
19 % of GDP
Household income or consumption by percentage share
Highest 10%:
27.7% (2017 est.)
Lowest 10%:
2.2% (2017 est.)
Note:
<b>note:</b> % share of income accruing to lowest and highest 10% of population
Imports
$5.74 billion
Imports 2022:
$5.005 billion (2022 est.)
Imports 2023:
$5.38 billion (2023 est.)
Imports 2024:
$6.094 billion (2024 est.)
Note:
<strong>note:</strong> GDP expenditure basis - imports of goods and services in current dollars
Imports - commodities
ships, refined petroleum, iron pipes, cars, packaged medicine (2023)
note:
<b>note:</b> top five import commodities based on value in dollars
Imports - partners
France 14%, China 13%, S. Korea 13%, USA 7%, India 4% (2023)
note:
<b>note:</b> top five import partners based on percentage share of imports
Industrial production growth rate
2.8% (2024 est.)
note:
<b>note:</b> annual % change in industrial value added based on constant local currency
Industries
petroleum extraction and refining; manganese, gold; chemicals, ship repair, food and beverages, textiles, lumbering and plywood, cement
Inflation rate (consumer prices)
1.17%
Inflation rate (consumer prices) 2022:
4.2% (2022 est.)
Inflation rate (consumer prices) 2023:
3.6% (2023 est.)
Inflation rate (consumer prices) 2024:
1.2% (2024 est.)
Note:
<b>note:</b> annual % change based on consumer prices
Labor force
824,400 (2024 est.)
note:
<b>note:</b> number of people ages 15 or older who are employed or seeking work
total:
844,145 persons
Labor force - by occupation
agriculture:
28.87%
industry:
18.85%
services:
52.28%
Population below poverty line
33.4% (2017 est.)
note:
<b>note:</b> % of population with income below national poverty line
Public debt
Public debt 2016:
64.2% of GDP (2016 est.)
Real GDP (purchasing power parity)
$54.61 billion
Note:
<b>note:</b> data in 2021 dollars
Real GDP (purchasing power parity) 2022:
$45.363 billion (2022 est.)
Real GDP (purchasing power parity) 2023:
$46.472 billion (2023 est.)
Real GDP (purchasing power parity) 2024:
$48.045 billion (2024 est.)
Real GDP growth rate
3.39%
Note:
<b>note:</b> annual GDP % growth based on constant local currency
Real GDP growth rate 2022:
3% (2022 est.)
Real GDP growth rate 2023:
2.4% (2023 est.)
Real GDP growth rate 2024:
3.4% (2024 est.)
Real GDP per capita
$21,510
Note:
<b>note:</b> data in 2021 dollars
Real GDP per capita 2022:
$18,700 (2022 est.)
Real GDP per capita 2023:
$18,700 (2023 est.)
Real GDP per capita 2024:
$18,900 (2024 est.)
Remittances
Note:
<b>note:</b> personal transfers and compensation between resident and non-resident individuals/households/entities
Remittances 2021:
0.1% of GDP (2021 est.)
Remittances 2022:
0.1% of GDP (2022 est.)
Remittances 2023:
0.1% of GDP (2023 est.)
Reserves of foreign exchange and gold
$1.45 billion
Note:
<b>note:</b> holdings of gold (year-end prices)/foreign exchange/special drawing rights in current dollars
Reserves of foreign exchange and gold 2021:
$1.304 billion (2021 est.)
Reserves of foreign exchange and gold 2022:
$1.415 billion (2022 est.)
Reserves of foreign exchange and gold 2023:
$1.447 billion (2023 est.)
Revenue (excl grants)
15 % of GDP
Tax revenue
9 % of GDP
Taxes and other revenues
9.5% (of GDP) (2021 est.)
note:
<b>note:</b> central government tax revenue as a % of GDP
Unemployment rate
20.15%
Note:
<b>note:</b> % of labor force seeking employment
Unemployment rate 2022:
20.4% (2022 est.)
Unemployment rate 2023:
20.3% (2023 est.)
Unemployment rate 2024:
20.1% (2024 est.)
Youth unemployment rate (ages 15-24)
Female:
42.3% (2024 est.)
Male:
31.1% (2024 est.)
Note:
<b>note:</b> % of labor force ages 15-24 seeking employment
Total:
36% (2024 est.)
World Bank Indicators
Broad Money
22.93 (2019)
Currency
British pound (GBP) (2025)
Current Account Balance (US$)
$141.00M (2015)
Exchange Rate
606 (2024)
Exports (US$)
$13.49B (2024)
External Debt
$6.82B (2024)
FDI Net Inflows (US$)
5.48 (2024)
GDP Growth (%)
3.39 (2024)
GDP Per Capita
8,230 (2024)
GDP (Current US$)
$20.90B (2024)
Gini Index
38.00 (2017)
Govt Expenditure
14.05 (2021)
Govt Revenue
15.11 (2021)
Imports (US$)
$5.74B (2024)
Inflation Rate (%)
1.17 (2024)
Languages
English (2025)
Population
$2.54M (2024)
Reserves
$638.79M (2024)
Trade Pct Gdp
92.05 (2024)
Unemployment Rate (%)
20.15 (2025)
Youth Unemployment
36.28 (2025)
Economic Rankings
Unemployment Rate
#6
External Debt
#78
Gini Index
#81
GDP per Capita
#87
Exports
#105
GDP (Nominal)
#123
GDP (PPP)
#128
Reserves
#134
Imports
#143
GDP Growth Rate
#146
Inflation Rate
#174
Quick Facts
Industries
petroleum extraction and refining; manganese, gold; chemicals, ship repair, food and beverages, textiles, lumbering and plywood, cement
Agricultural products
oil palm fruit, plantains, cassava, sugarcane, yams, taro, vegetables, maize, groundnuts, game meat (2023)
Labor force
824,400 (2024 est.)
Exports - partners
China 26%, Indonesia 8%, Spain 7%, Israel 6%, Congo, Republic of the 5% (2023)
Imports - partners
France 14%, China 13%, S. Korea 13%, USA 7%, India 4% (2023)
Exchange rates
Coopération Financière en Afrique Centrale francs (XAF) per US dollar -
Explore More
Our Partners
Trusted partner applications powering global data and insights