Countries
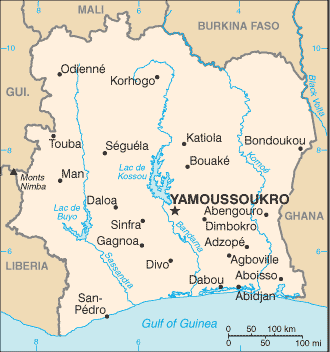
Cote d'Ivoire

Key Economic Indicators
$244.91 billion
$7,669
6.02%
3.45%
2.32%
$86.538 billion (2024 est.)
47% of GDP (2016 est.)
$-9,208,027,599
Economic Overview
one of West Africa’s most influential, stable, and rapidly developing economies; poverty declines in urban but increases in rural areas; strong construction sector and increasingly diverse economic portfolio; increasing but manageable public debt; large labor force in agriculture
All Economic Data
Agricultural products
yams, cassava, oil palm fruit, cocoa beans, sugarcane, plantains, rice, rubber, maize, cashews (2023)
note:
<b>note:</b> top ten agricultural products based on tonnage
Average household expenditures
On alcohol and tobacco:
3.2% of household expenditures (2023 est.)
On food:
37.7% of household expenditures (2023 est.)
Budget
Expenditures:
$16.03 billion (2023 est.)
Note:
<b>note:</b> central government revenues (excluding grants) and expenditures converted to US dollars at average official exchange rate for year indicated
Revenues:
$12.351 billion (2023 est.)
Currency
code:
XOF
name:
West African CFA franc (XOF) [Fr]
Current account balance
$-9,208,027,599
Current account balance 2020:
-$1.974 billion (2020 est.)
Current account balance 2021:
-$2.874 billion (2021 est.)
Current account balance 2022:
-$5.394 billion (2022 est.)
Note:
<b>note:</b> balance of payments - net trade and primary/secondary income in current dollars
Debt - external
$40.56 billion
Debt - external 2023:
$26.576 billion (2023 est.)
Note:
<b>note:</b> present value of external debt in current US dollars
Exchange rates
Currency:
Communaute Financiere Africaine francs (XOF) per US dollar -
Exchange rates 2020:
575.586 (2020 est.)
Exchange rates 2021:
554.531 (2021 est.)
Exchange rates 2022:
623.76 (2022 est.)
Exchange rates 2023:
606.57 (2023 est.)
Exchange rates 2024:
606.345 (2024 est.)
Exports
$22.67 billion
Exports 2020:
$13.232 billion (2020 est.)
Exports 2021:
$16.23 billion (2021 est.)
Exports 2022:
$17.211 billion (2022 est.)
Note:
<b>note:</b> balance of payments - exports of goods and services in current dollars
Exports - commodities
gold, cocoa beans, rubber, refined petroleum, coconuts/brazil nuts/cashews (2023)
note:
<b>note:</b> top five export commodities based on value in dollars
Exports - partners
Switzerland 17%, Netherlands 9%, Mali 7%, USA 5%, Malaysia 4% (2023)
note:
<b>note:</b> top five export partners based on percentage share of exports
Foreign direct investment
net inflows:
$3.12 billion
GDP - composition, by end use
Exports of goods and services:
27.6% (2024 est.)
Government consumption:
9% (2024 est.)
Household consumption:
66% (2024 est.)
Imports of goods and services:
-27.1% (2024 est.)
Investment in fixed capital:
24.5% (2024 est.)
Investment in inventories:
0% (2024 est.)
Note:
<b>note:</b> figures may not total 100% due to rounding or gaps in data collection
GDP - composition, by sector of origin
Agriculture:
17.9% (2024 est.)
Industry:
22.1% (2024 est.)
Note:
<b>note:</b> figures may not total 100% due to non-allocated consumption not captured in sector-reported data
Services:
53.9% (2024 est.)
GDP (official exchange rate)
$86.538 billion (2024 est.)
note:
<b>note:</b> data in current dollars at official exchange rate
GDP per capita (nominal)
$2,728
Gini Index coefficient - distribution of family income
41.5 (2015)
Gini Index coefficient - distribution of family income 2021:
35.3 (2021 est.)
Note:
<b>note:</b> index (0-100) of income distribution; higher values represent greater inequality
GNI (gross national income)
$83.63 billion
GNI per capita
$2,530
Gross domestic investment
21 % of GDP
Household income or consumption by percentage share
Highest 10%:
27.8% (2021 est.)
Lowest 10%:
3.1% (2021 est.)
Note:
<b>note:</b> % share of income accruing to lowest and highest 10% of population
Imports
$21.98 billion
Imports 2020:
$12.66 billion (2020 est.)
Imports 2021:
$16.191 billion (2021 est.)
Imports 2022:
$19.948 billion (2022 est.)
Note:
<b>note:</b> balance of payments - imports of goods and services in current dollars
Imports - commodities
crude petroleum, ships, refined petroleum, fish, rice (2023)
note:
<b>note:</b> top five import commodities based on value in dollars
Imports - partners
China 16%, Nigeria 12%, France 6%, India 5%, USA 4% (2023)
note:
<b>note:</b> top five import partners based on percentage share of imports
Industrial production growth rate
2.8% (2024 est.)
note:
<b>note:</b> annual % change in industrial value added based on constant local currency
Industries
foodstuffs, beverages; wood products, oil refining, gold mining, truck and bus assembly, textiles, fertilizer, building materials, electricity
Inflation rate (consumer prices)
3.45%
Inflation rate (consumer prices) 2022:
5.3% (2022 est.)
Inflation rate (consumer prices) 2023:
4.4% (2023 est.)
Inflation rate (consumer prices) 2024:
3.5% (2024 est.)
Note:
<b>note:</b> annual % change based on consumer prices
Labor force
12.595 million (2024 est.)
note:
<b>note:</b> number of people ages 15 or older who are employed or seeking work
total:
13.07 million persons
Labor force - by occupation
agriculture:
45.37%
industry:
14.33%
services:
40.3%
Population below poverty line
37.5% (2021 est.)
note:
<b>note:</b> % of population with income below national poverty line
Public debt
Public debt 2016:
47% of GDP (2016 est.)
Real GDP (purchasing power parity)
$244.91 billion
Note:
<b>note:</b> data in 2021 dollars
Real GDP (purchasing power parity) 2022:
$190.645 billion (2022 est.)
Real GDP (purchasing power parity) 2023:
$202.943 billion (2023 est.)
Real GDP (purchasing power parity) 2024:
$215.018 billion (2024 est.)
Real GDP growth rate
6.02%
Note:
<b>note:</b> annual GDP % growth based on constant local currency
Real GDP growth rate 2022:
6.4% (2022 est.)
Real GDP growth rate 2023:
6.5% (2023 est.)
Real GDP growth rate 2024:
6% (2024 est.)
Real GDP per capita
$7,669
Note:
<b>note:</b> data in 2021 dollars
Real GDP per capita 2022:
$6,300 (2022 est.)
Real GDP per capita 2023:
$6,500 (2023 est.)
Real GDP per capita 2024:
$6,700 (2024 est.)
Remittances
$1.77 billion
Note:
<b>note:</b> personal transfers and compensation between resident and non-resident individuals/households/entities
Remittances 2021:
0.6% of GDP (2021 est.)
Remittances 2022:
1.5% of GDP (2022 est.)
Remittances 2023:
1.3% of GDP (2023 est.)
Revenue (excl grants)
13 % of GDP
Tax revenue
13 % of GDP
Taxes and other revenues
13.2% (of GDP) (2023 est.)
note:
<b>note:</b> central government tax revenue as a % of GDP
Unemployment rate
2.32%
Note:
<b>note:</b> % of labor force seeking employment
Unemployment rate 2022:
2.4% (2022 est.)
Unemployment rate 2023:
2.3% (2023 est.)
Unemployment rate 2024:
2.3% (2024 est.)
Youth unemployment rate (ages 15-24)
Female:
4.4% (2024 est.)
Male:
3.5% (2024 est.)
Note:
<b>note:</b> % of labor force ages 15-24 seeking employment
Total:
3.9% (2024 est.)
World Bank Indicators
Broad Money
37.52 (2024)
Current Account Balance (US$)
-3,892,313,520.54 (2024)
Exchange Rate
606 (2024)
Exports (US$)
$22.67B (2024)
External Debt
$40.56B (2024)
FDI Net Inflows (US$)
3.58 (2024)
GDP Growth (%)
6.02 (2024)
GDP Per Capita
2,728 (2024)
GDP (Current US$)
$87.11B (2024)
Gini Index
35.30 (2021)
Government Debt (% GDP)
171 (1995)
Govt Expenditure
17.88 (2023)
Govt Revenue
13.37 (2023)
Imports (US$)
$21.98B (2024)
Inflation Rate (%)
3.45 (2024)
Population
$31.93M (2024)
Trade Pct Gdp
51.26 (2024)
Unemployment Rate (%)
2.32 (2025)
Youth Unemployment
4.01 (2025)
Economic Rankings
External Debt
#34
GDP Growth Rate
#55
Gini Index
#57
GDP (PPP)
#75
GDP (Nominal)
#75
Exports
#88
Imports
#93
GDP per Capita
#141
Inflation Rate
#157
Unemployment Rate
#163
Quick Facts
Industries
foodstuffs, beverages; wood products, oil refining, gold mining, truck and bus assembly, textiles, fertilizer, building materials, electricity
Agricultural products
yams, cassava, oil palm fruit, cocoa beans, sugarcane, plantains, rice, rubber, maize, cashews (2023)
Labor force
12.595 million (2024 est.)
Exports - partners
Switzerland 17%, Netherlands 9%, Mali 7%, USA 5%, Malaysia 4% (2023)
Imports - partners
China 16%, Nigeria 12%, France 6%, India 5%, USA 4% (2023)
Exchange rates
Communaute Financiere Africaine francs (XOF) per US dollar -
Explore More
Our Partners
Trusted partner applications powering global data and insights