Countries
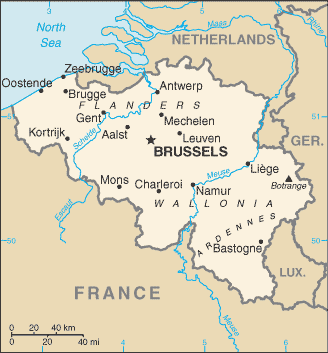
Belgium

Key Economic Indicators
$871.78 billion
$73,514
1.07%
3.14%
5.91%
$664.564 billion (2024 est.)
<b>note:</b> central government debt as a % of GDP
$-2,543,070,284
Economic Overview
<p>high-income, core EU and eurozone economy; slow growth with weakened domestic consumption and export demand; high public debt and structural deficits linked to social spending; aging workforce with weak productivity growth and participation rates</p>
All Economic Data
Agricultural products
sugar beets, milk, potatoes, wheat, pork, lettuce, maize, chicken, barley, pears (2023)
note:
<b>note:</b> top ten agricultural products based on tonnage
Average household expenditures
On alcohol and tobacco:
4% of household expenditures (2023 est.)
On food:
12.2% of household expenditures (2023 est.)
Budget
Expenditures:
$235.767 billion (2022 est.)
Note:
<b>note:</b> central government revenues (excluding grants) and expenditures converted to US dollars at average official exchange rate for year indicated
Revenues:
$220.657 billion (2022 est.)
Currency
code:
EUR
name:
euro (EUR) [€]
Current account balance
$-2,543,070,284
Current account balance 2022:
-$7.031 billion (2022 est.)
Current account balance 2023:
-$4.503 billion (2023 est.)
Current account balance 2024:
-$5.679 billion (2024 est.)
Note:
<b>note:</b> balance of payments - net trade and primary/secondary income in current dollars
Exchange rates
Currency:
euros (EUR) per US dollar -
Exchange rates 2020:
0.876 (2020 est.)
Exchange rates 2021:
0.845 (2021 est.)
Exchange rates 2022:
0.95 (2022 est.)
Exchange rates 2023:
0.925 (2023 est.)
Exchange rates 2024:
0.924 (2024 est.)
Exports
$532.22 billion
Exports 2022:
$565.233 billion (2022 est.)
Exports 2023:
$542.508 billion (2023 est.)
Exports 2024:
$525.458 billion (2024 est.)
Note:
<b>note:</b> balance of payments - exports of goods and services in current dollars
Exports - commodities
refined petroleum, natural gas, vaccines, cars, packaged medicine (2023)
note:
<b>note:</b> top five export commodities based on value in dollars
Exports - partners
France 20%, Netherlands 15%, Germany 14%, Italy 6%, USA 5% (2023)
note:
<b>note:</b> top five export partners based on percentage share of exports
Foreign direct investment
net inflows:
$-41,357,732,773
GDP - composition, by end use
Exports of goods and services:
84.2% (2023 est.)
Government consumption:
23.8% (2023 est.)
Household consumption:
50.4% (2023 est.)
Imports of goods and services:
-84.8% (2023 est.)
Investment in fixed capital:
24.4% (2023 est.)
Investment in inventories:
1% (2023 est.)
Note:
<b>note:</b> figures may not total 100% due to rounding or gaps in data collection
GDP - composition, by sector of origin
Agriculture:
0.8% (2024 est.)
Industry:
17.6% (2024 est.)
Note:
<b>note:</b> figures may not total 100% due to non-allocated consumption not captured in sector-reported data
Services:
72.1% (2024 est.)
GDP (official exchange rate)
$664.564 billion (2024 est.)
note:
<b>note:</b> data in current dollars at official exchange rate
GDP per capita (nominal)
$56,615
Gini Index coefficient - distribution of family income
27.2 (2018)
Gini Index coefficient - distribution of family income 2022:
26.4 (2022 est.)
Note:
<b>note:</b> index (0-100) of income distribution; higher values represent greater inequality
GNI (gross national income)
$682.33 billion
GNI per capita
$55,290
Gross domestic investment
24 % of GDP
Household income or consumption by percentage share
Highest 10%:
22.2% (2022 est.)
Lowest 10%:
3.8% (2022 est.)
Note:
<b>note:</b> % share of income accruing to lowest and highest 10% of population
Imports
$534.8 billion
Imports 2022:
$573.192 billion (2022 est.)
Imports 2023:
$546.426 billion (2023 est.)
Imports 2024:
$531.029 billion (2024 est.)
Note:
<b>note:</b> balance of payments - imports of goods and services in current dollars
Imports - commodities
cars, natural gas, vaccines, packaged medicine, crude petroleum (2023)
note:
<b>note:</b> top five import commodities based on value in dollars
Imports - partners
Netherlands 20%, Germany 13%, France 11%, USA 7%, Ireland 4% (2023)
note:
<b>note:</b> top five import partners based on percentage share of imports
Industrial production growth rate
-0.6% (2024 est.)
note:
<b>note:</b> annual % change in industrial value added based on constant local currency
Industries
engineering and metal products, motor vehicle assembly, transportation equipment, scientific instruments, processed food and beverages, chemicals, pharmaceuticals, base metals, textiles, glass, petroleum
Inflation rate (consumer prices)
3.14%
Inflation rate (consumer prices) 2022:
9.6% (2022 est.)
Inflation rate (consumer prices) 2023:
4% (2023 est.)
Inflation rate (consumer prices) 2024:
3.1% (2024 est.)
Note:
<b>note:</b> annual % change based on consumer prices
Labor force
5.416 million (2024 est.)
note:
<b>note:</b> number of people ages 15 or older who are employed or seeking work
total:
5.43 million persons
Labor force - by occupation
agriculture:
0.98%
industry:
19.25%
services:
79.77%
Population below poverty line
12.3% (2022 est.)
note:
<b>note:</b> % of population with income below national poverty line
Public debt
Note:
<b>note:</b> central government debt as a % of GDP
Public debt 2022:
92.5% of GDP (2022 est.)
Real GDP (purchasing power parity)
$871.78 billion
Note:
<b>note:</b> data in 2021 dollars
Real GDP (purchasing power parity) 2022:
$732.865 billion (2022 est.)
Real GDP (purchasing power parity) 2023:
$741.672 billion (2023 est.)
Real GDP (purchasing power parity) 2024:
$749.229 billion (2024 est.)
Real GDP growth rate
1.07%
Note:
<b>note:</b> annual GDP % growth based on constant local currency
Real GDP growth rate 2022:
4.3% (2022 est.)
Real GDP growth rate 2023:
1.2% (2023 est.)
Real GDP growth rate 2024:
1% (2024 est.)
Real GDP per capita
$73,514
Note:
<b>note:</b> data in 2021 dollars
Real GDP per capita 2022:
$62,700 (2022 est.)
Real GDP per capita 2023:
$62,900 (2023 est.)
Real GDP per capita 2024:
$63,100 (2024 est.)
Remittances
$15.48 billion
Note:
<b>note:</b> personal transfers and compensation between resident and non-resident individuals/households/entities
Remittances 2022:
2.3% of GDP (2022 est.)
Remittances 2023:
2.3% of GDP (2023 est.)
Remittances 2024:
2.3% of GDP (2024 est.)
Reserves of foreign exchange and gold
$41.45 billion
Note:
<b>note:</b> holdings of gold (year-end prices)/foreign exchange/special drawing rights in current dollars
Reserves of foreign exchange and gold 2022:
$41.274 billion (2022 est.)
Reserves of foreign exchange and gold 2023:
$40.813 billion (2023 est.)
Reserves of foreign exchange and gold 2024:
$41.449 billion (2024 est.)
Revenue (excl grants)
37 % of GDP
Tax revenue
23 % of GDP
Taxes and other revenues
22.7% (of GDP) (2022 est.)
note:
<b>note:</b> central government tax revenue as a % of GDP
Unemployment rate
5.91%
Note:
<b>note:</b> % of labor force seeking employment
Unemployment rate 2022:
5.6% (2022 est.)
Unemployment rate 2023:
5.6% (2023 est.)
Unemployment rate 2024:
5.5% (2024 est.)
Youth unemployment rate (ages 15-24)
Female:
14.7% (2024 est.)
Male:
18.6% (2024 est.)
Note:
<b>note:</b> % of labor force ages 15-24 seeking employment
Total:
16.8% (2024 est.)
World Bank Indicators
Currency
euro (EUR) (2025)
Exports (US$)
$532.22B (2024)
FDI Net Inflows (US$)
-41,357,732,773.29 (2024)
GDP Growth (%)
1.07 (2024)
Gdp Nominal
$671.37B (2024)
GDP Per Capita
56,615 (2024)
Gini Index
27.20 (2018)
Imports (US$)
$534.80B (2024)
Inflation Rate (%)
3.14 (2024)
Inflation Rate
3.14 (2024)
Languages
German, French, Dutch (2025)
Reserves
$41.45B (2024)
Unemployment Rate (%)
5.70 (2024)
Unemployment Rate
5.70 (2024)
Youth Unemployment
17.34 (2024)
Economic Rankings
Imports
#16
Exports
#18
GDP per Capita
#20
GDP (Nominal)
#22
GDP (PPP)
#36
Reserves
#50
Inflation Rate
#80
Unemployment Rate
#85
GDP Growth Rate
#116
Gini Index
#164
Quick Facts
Industries
engineering and metal products, motor vehicle assembly, transportation equipment, scientific instruments, processed food and beverages, chemicals, pharmaceuticals, base metals, textiles, glass, petrol
Agricultural products
sugar beets, milk, potatoes, wheat, pork, lettuce, maize, chicken, barley, pears (2023)
Labor force
5.416 million (2024 est.)
Exports - partners
France 20%, Netherlands 15%, Germany 14%, Italy 6%, USA 5% (2023)
Imports - partners
Netherlands 20%, Germany 13%, France 11%, USA 7%, Ireland 4% (2023)
Exchange rates
euros (EUR) per US dollar -
Explore More
Our Partners
Trusted partner applications powering global data and insights