2015 Edition
CIA World Factbook 2015 Archive (Wayback Machine ZIP)
Introduction
Background
- The UK annexed Southern Rhodesia from the former British South Africa Company in 1923. A 1961 constitution was formulated that favored whites in power. In 1965 the government unilaterally declared its independence, but the UK did not recognize the act and demanded more complete voting rights for the black African majority in the country (then called Rhodesia). UN sanctions and a guerrilla uprising finally led to free elections in 1979 and independence (as Zimbabwe) in 1980. Robert MUGABE, the nation's first prime minister, has been the country's only ruler (as president since 1987) and has dominated the country's political system since independence. His chaotic land redistribution campaign, which began in 1997 and intensified after 2000, caused an exodus of white farmers, crippled the economy, and ushered in widespread shortages of basic commodities. Ignoring international condemnation, MUGABE rigged the 2002 presidential election to ensure his reelection.
- In April 2005, the capital city of Harare embarked on Operation Restore Order, ostensibly an urban rationalization program, which resulted in the destruction of the homes or businesses of 700,000 mostly poor supporters of the opposition. MUGABE in June 2007 instituted price controls on all basic commodities causing panic buying and leaving store shelves empty for months. General elections held in March 2008 contained irregularities but still amounted to a censure of the ZANU-PF-led government with the opposition winning a majority of seats in parliament. Movement for Democratic Change - Tsvangirai opposition leader Morgan TSVANGIRAI won the most votes in the presidential poll, but not enough to win outright. In the lead up to a run-off election in late June 2008, considerable violence against opposition party members led to the withdrawal of TSVANGIRAI from the ballot. Extensive evidence of violence and intimidation resulted in international condemnation of the process. Difficult negotiations over a power-sharing "government of national unity," in which MUGABE remained president and TSVANGIRAI became prime minister, were finally settled in February 2009, although the leaders failed to agree upon many key outstanding governmental issues. MUGABE was reelected president in June 2013 in balloting that was severely flawed and internationally condemned. As a prerequisite to holding the election, Zimbabwe enacted a new constitution by referendum, although many provisions in the new constitution have yet to be codified in law.
Geography
Area
- land
- 386,847 sq km
- total
- 390,757 sq km
- water
- 3,910 sq km
Area - comparative
slightly larger than Montana
Climate
tropical; moderated by altitude; rainy season (November to March)
Coastline
0 km (landlocked)
Elevation extremes
- highest point
- Inyangani 2,592 m
- lowest point
- junction of the Runde and Save Rivers 162 m
Environment - current issues
deforestation; soil erosion; land degradation; air and water pollution; the black rhinoceros herd - once the largest concentration of the species in the world - has been significantly reduced by poaching; poor mining practices have led to toxic waste and heavy metal pollution
Environment - international agreements
- party to
- Biodiversity, Climate Change, Desertification, Endangered Species, Law of the Sea, Ozone Layer Protection
- signed, but not ratified
- none of the selected agreements
Freshwater withdrawal (domestic/industrial/agricultural)
- per capita
- 333.5 cu m/yr (2002)
- total
- 4.21 cu km/yr (14%/7%/79%)
Geographic coordinates
20 00 S, 30 00 E
Geography - note
landlocked; the Zambezi forms a natural riverine boundary with Zambia; in full flood (February-April) the massive Victoria Falls on the river forms the world's largest curtain of falling water; Lake Kariba on the Zambia-Zimbabwe border forms the world's largest reservoir by volume (180 cu km; 43 cu mi)
Irrigated land
1,735 sq km (2003)
Land boundaries
- border countries (4)
- Botswana 834 km, Mozambique 1,402 km, South Africa 230 km, Zambia 763 km
- total
- 3,229 km
Land use
- arable land 10.9%; permanent crops 0.3%; permanent pasture 31.3%
- agricultural land
- 42.5%
- forest
- 39.5%
- other
- 18% (2011 est.)
Location
Southern Africa, between South Africa and Zambia
Map references
Africa
Maritime claims
none (landlocked)
Natural hazards
recurring droughts; floods and severe storms are rare
Natural resources
coal, chromium ore, asbestos, gold, nickel, copper, iron ore, vanadium, lithium, tin, platinum group metals
Terrain
mostly high plateau with higher central plateau (high veld); mountains in east
Total renewable water resources
20 cu km (2011)
People and Society
Age structure
- 0-14 years
- 37.88% (male 2,723,586/female 2,666,624)
- 15-24 years
- 21.65% (male 1,550,518/female 1,530,737)
- 25-54 years
- 33.4% (male 2,485,086/female 2,267,125)
- 55-64 years
- 3.57% (male 184,517/female 324,079)
- 65 years and over
- 3.49% (male 193,928/female 303,341) (2015 est.)
Birth rate
32.26 births/1,000 population (2015 est.)
Children under the age of 5 years underweight
11.2% (2014)
Contraceptive prevalence rate
58.5% (2010/11)
Death rate
10.13 deaths/1,000 population (2015 est.)
Dependency ratios
- elderly dependency ratio
- 5.3%
- potential support ratio
- 18.7% (2015 est.)
- total dependency ratio
- 80.4%
- youth dependency ratio
- 75%
Drinking water source
- urban: 97% of population
- rural: 67.3% of population
- total: 76.9% of population
- urban: 3% of population
- rural: 32.7% of population
- total: 23.1% of population (2015 est.)
Education expenditures
2% of GDP (2010)
Ethnic groups
African 99.4% (predominantly Shona; Ndebele is the second largest ethnic group), other 0.4%, unspecified 0.2% (2012 est.)
HIV/AIDS - adult prevalence rate
16.74% (2014 est.)
HIV/AIDS - deaths
38,600 (2014 est.)
HIV/AIDS - people living with HIV/AIDS
1,550,300 (2014 est.)
Hospital bed density
1.7 beds/1,000 population (2011)
Infant mortality rate
- female
- 23.76 deaths/1,000 live births (2015 est.)
- male
- 28.4 deaths/1,000 live births
- total
- 26.11 deaths/1,000 live births
Languages
Shona (official; most widely spoken), Ndebele (official, second most widely spoken), English (official; traditionally used for official business), 13 minority languages (official; includes Chewa, Chibarwe, Kalanga, Koisan, Nambya, Ndau, Shangani, sign language, Sotho, Tonga, Tswana, Venda, and Xhosa)
Life expectancy at birth
- female
- 57.57 years (2015 est.)
- male
- 56.54 years
- total population
- 57.05 years
Literacy
- definition
- age 15 and over can read and write English
- female
- 84.6% (2015 est.)
- male
- 88.5%
- total population
- 86.5%
Major infectious diseases
- animal contact disease
- rabies (2013)
- degree of risk
- very high
- food or waterborne diseases
- bacterial and protozoal diarrhea, hepatitis A, and typhoid fever
- vectorborne diseases
- malaria and dengue fever
- water contact disease
- schistosomiasis
Major urban areas - population
HARARE (capital) 1.501 million (2015)
Median age
- female
- 20.7 years (2015 est.)
- male
- 20.4 years
- total
- 20.35 years
Nationality
- adjective
- Zimbabwean
- noun
- Zimbabwean(s)
Net migration rate
- 0 migrant(s)/1,000 population
- note
- there is an increasing flow of Zimbabweans into South Africa and Botswana in search of better economic opportunities (2015 est.)
Obesity - adult prevalence rate
8.4% (2014)
Physicians density
0.08 physicians/1,000 population (2011)
Population
- 14,229,541
- note
- estimates for this country explicitly take into account the effects of excess mortality due to AIDS; this can result in lower life expectancy, higher infant mortality, higher death rates, lower population growth rates, and changes in the distribution of population by age and sex than would otherwise be expected (July 2015 est.)
Population growth rate
2.21% (2015 est.)
Religions
Protestant 75.9% (includes Apostolic 38%, Pentecostal 21.1%, other 16.8%), Roman Catholic 8.4%, other Christian 8.4%, other 1.2% (includes traditional, Muslim), none 6.1% (2011 est.)
Sanitation facility access
- urban: 49.3% of population
- rural: 30.8% of population
- total: 36.8% of population
- urban: 50.7% of population
- rural: 69.2% of population
- total: 63.2% of population (2015 est.)
School life expectancy (primary to tertiary education)
- female
- 11 years (2012)
- male
- 11 years
- total
- 11 years
Sex ratio
- 0-14 years
- 1.02 male(s)/female
- 15-24 years
- 1.01 male(s)/female
- 25-54 years
- 1.1 male(s)/female
- 55-64 years
- 0.57 male(s)/female
- 65 years and over
- 0.64 male(s)/female
- at birth
- 1.03 male(s)/female
- total population
- 1.01 male(s)/female (2015 est.)
Total fertility rate
3.53 children born/woman (2015 est.)
Unemployment, youth ages 15-24
- female
- 7.6% (2004 est.)
- male
- 7.6%
- total
- 7.6%
Urbanization
- rate of urbanization
- 2.3% annual rate of change (2010-15 est.)
- urban population
- 32.4% of total population (2015)
Government
Administrative divisions
8 provinces and 2 cities* with provincial status; Bulawayo*, Harare*, Manicaland, Mashonaland Central, Mashonaland East, Mashonaland West, Masvingo, Matabeleland North, Matabeleland South, Midlands
Capital
- geographic coordinates
- 17 49 S, 31 02 E
- name
- Harare
- time difference
- UTC+2 (7 hours ahead of Washington, DC, during Standard Time)
Constitution
previous 1979; latest approved by referendum 16 March 2013, approved by Parliament 9 May 2013 (2013)
Country name
- conventional long form
- Republic of Zimbabwe
- conventional short form
- Zimbabwe
- former
- Southern Rhodesia, Rhodesia
Diplomatic representation from the US
- chief of mission
- Ambassador David Bruce WHARTON (since 15 November 2012)
- embassy
- 172 Herbert Chitepo Avenue, Harare
- FAX
- [263] (4) 796-488, or 722-618
- mailing address
- P. O. Box 3340, Harare
- telephone
- [263] (4) 250-593 through 250-594
Diplomatic representation in the US
- chancery
- 1608 New Hampshire Avenue NW, Washington, DC 20009
- chief of mission
- Ambassador Ammon MUTEMBWA (since 18 November 2014)
- FAX
- [1] (202) 483-9326
- telephone
- [1] (202) 332-7100
Executive branch
- cabinet
- Cabinet appointed by president, responsible to House of Assembly
- chief of state
- Executive President Robert Gabriel MUGABE (since 31 December 1987); Vice Presidents Emmerson Dambudzo MNANGAGWA and Phelekezela MPHOKO (both since 12 December 2014); note - Vice President Joice MUJURU (since 6 December 2004) was dismissed 9 December 2014
- election results
- Robert Gabriel MUGABE reelected president; percent of vote - Robert Gabriel MUGABE (ZANU-PF) 61.1%, Morgan TSVANGIRAI (MDC-T) 34.4%, Welshman NCUBE (MDC-N) 2.7%, other 1.8%; note - the election process was considered flawed and roundly criticized by election monitors and international bodies; both the African Union and the South African Development Community endorsed the results of the election with some concerns
- elections/appointments
- each presidential candidate nominated with a nomination paper signed by at least 10 registered voters (at least 1 candidate from each province) and directly elected by absolute majority popular vote in 2 rounds if needed for a 5-year term (no term limits); election last held on 31 July 2013 (next to be held in 2018); co-vice presidents drawn from party leadership
- head of government
- Executive President Robert Gabriel MUGABE (since 31 December 1987); note - following the 31 July 2013 presidential election, the position of prime minister was abolished
Flag description
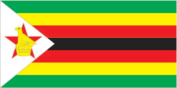
seven equal horizontal bands of green, yellow, red, black, red, yellow, and green with a white isosceles triangle edged in black with its base on the hoist side; a yellow Zimbabwe bird representing the long history of the country is superimposed on a red five-pointed star in the center of the triangle, which symbolizes peace; green represents agriculture, yellow mineral wealth, red the blood shed to achieve independence, and black stands for the native people
Government type
parliamentary democracy
Independence
18 April 1980 (from the UK)
International law organization participation
has not submitted an ICJ jurisdiction declaration; non-party state to the ICCt
International organization participation
ACP, AfDB, AU, COMESA, FAO, G-15, G-77, IAEA, IBRD, ICAO, ICRM, IDA, IFAD, IFC, IFRCS, ILO, IMF, IMO, Interpol, IOC, IOM, IPU, ISO, ITSO, ITU, ITUC (NGOs), MIGA, NAM, OPCW, PCA, SADC, UN, UNAMID, UNCTAD, UNESCO, UNIDO, UNMIL, UNMISS, UNOCI, UNWTO, UPU, WCO, WFTU (NGOs), WHO, WIPO, WMO, WTO
Judicial branch
- highest court(s)
- Supreme Court (consists of the chief justice and 4 judges)
- judge selection and term of office
- Supreme Court judges appointed by the president upon recommendation of the Judicial Service Commission, an independent body consisting of the chief justice, Public Service Commission chairman, attorney general, and 2-3 members appointed by the president; judges normally serve until age 65 but can elect to serve until age 70
- subordinate courts
- High Court, regional magistrate courts, and special courts
Legal system
mixed legal system of English common law, Roman-Dutch civil law, and customary law
Legislative branch
- description
- bicameral Parliament consists of the Senate (80 seats; 60 members directly elected in multi-seat constituencies - 6 seats in each of the 10 provinces - by proportional representation vote, 16 indirectly elected by the regional governing councils, 2 reserved for the National Council Chiefs, and 2 reserved for members with disabilities; members serve 5-year terms) and the House of Assembly (270 seats; 210 members directly elected in single-seat constituencies by simple majority vote and 60 seats reserved for women directly elected by proportional representation vote; members serve 5-year terms)
- election results
- Senate - percent of vote by party - NA; seats by party - ZANU-PF 37 MDC-T 21, MDC-N 2, chiefs 18, people with disabilities 2; House of Assembly - percent of vote by party - NA; seats by party - ZANU-PF 197, MDC-T 70, MDC-N 2, independent 1
- elections
- last held on 31 July 2013 (next to be held in 2018)
National anthem
- lyrics/music
- Solomon MUTSWAIRO/Fred Lecture CHANGUNDEGA
- name
- "Kalibusiswe Ilizwe leZimbabwe" [Northern Ndebele language] "Simudzai Mureza WeZimbabwe" [Shona] (Blessed Be the Land of Zimbabwe)
- note
- adopted 1994
National holiday
Independence Day, 18 April (1980)
National symbol(s)
Zimbabwe bird symbol, African fish eagle, flame lily; national colors: green, yellow, red, black, white
Political parties and leaders
- African National Party or ANP [Egypt DZINEMUNHENZVA]
- Freedom Party [Cosmas MPONDA]
- Movambo Kusile Dawn or MKD [Simba MAKONI]
- Movement for Democratic Change - Ncube or MDC-N [Welshman NCUBE]
- Movement for Democratic Change - Renewal or MDC-R [Sekai HOLLAND]; note - has been kicked out of Parliament as of 17 May 2015
- Movement for Democratic Change - Tsvangirai or MDC-T [Morgan TSVANGIRAI]
- Transform Zimbabwe or TZ [Jacob NGARIVHUME]
- United Parties [Abel MUZOREWA]
- Zimbabwe African National Union-Ndonga or ZANU-Ndonga [Wilson KUMBULA]
- Zimbabwe African National Union-Patriotic Front or ZANU-PF [Robert Gabriel MUGABE]
- Zimbabwe African Peoples Union or ZAPU [Dumiso DABENGWA]
Political pressure groups and leaders
- Crisis in Zimbabwe Coalition
- National Constitutional Assembly or NCA [Lovemore MADHUKU]
- Women of Zimbabwe Arise or WOZA [Jenni WILLIAMS]
- Zimbabwe Congress of Trade Unions or ZCTU [Japhet MOYO]
- Zimbabwe Lawyers for Human Rights or ZLHR [Irene PETRAS]
Suffrage
18 years of age; universal
Economy
Agriculture - products
tobacco, corn, cotton, wheat, coffee, sugarcane, peanuts; sheep, goats, pigs
Budget
- expenditures
- $4.615 billion (2014)
- revenues
- $3.732 billion
Budget surplus (+) or deficit (-)
-6.4% of GDP (2014)
Central bank discount rate
- 7.17% (31 December 2010)
- 975% (31 December 2007)
Commercial bank prime lending rate
- 22% (31 December 2014 est.)
- 28% (31 December 2013 est.)
Current account balance
- -$3.044 billion (2014 est.)
- -$576 million (2013 est.)
Debt - external
- $9.361 billion (31 December 2014 est.)
- $8.71 billion (31 December 2013 est.)
Distribution of family income - Gini index
- 50.1 (2006)
- 50.1 (1995)
Economy - overview
Zimbabwe's economy depends heavily on its mining and agriculture sectors. Following a decade of contraction from 1998 to 2008, the economy recorded real growth of more than 10% per year from 2010-13, before slowing to roughly 3% in 2014 due to poor harvests, low diamond revenues, and decreased investment. Infrastructure and regulatory deficiencies, a poor investment climate, a large public and external debt burden, and extremely high government wage expenses impede the country’s economic performance. Until early 2009, the Reserve Bank of Zimbabwe (RBZ) routinely printed money to fund the budget deficit, causing hyperinflation. Dollarization in early 2009 - which allowed currencies such as the Botswana pula, the South Africa rand, and the US dollar to be used locally - ended hyperinflation and reduced inflation below 10% per year, but exposed structural weaknesses that inhibit broad-based growth. The RBZ introduced bond coins denominated in 1, 5, 10, and 25 cent increments on a par with the US dollar in December 2014, more than five years after the Zimbabwe dollar was taken out of circulation. In January 2015, as part of the government’s effort to boost trade and attract foreign investment, the RBZ announced that the Chinese renmimbi, Indian rupee, Australian dollar, and Japanese yen would be accepted as legal tender in Zimbabwe. Zimbabwe’s government entered a second Staff Monitored Program with the International Monetary Fund in 2014 and undertook other measures to reengage with international financial institutions. Foreign and domestic investment continues to be hindered by the lack of clarity regarding the government’s Indigenization and Economic Empowerment Act.
Exchange rates
- Zimbabwean dollars (ZWD) per US dollar -
- NA (2013)
- 234.25 (2010)
- 234.25 (2009)
- 9,686.8 (2007)
- note
- the dollar was adopted as a legal currency in 2009; since then the Zimbabwean dollar has experienced hyperinflation and is essentially worthless
Exports
- $3.263 billion (2014 est.)
- $3.144 billion (2013 est.)
Exports - commodities
platinum, cotton, tobacco, gold, ferroalloys, textiles/clothing
Exports - partners
China 27.8%, Democratic Republic of the Congo 12.3%, Botswana 11%, South Africa 6.8%, Belgium 4.4%, Zambia 4.1% (2014)
Fiscal year
calendar year
GDP - composition, by end use
- (2014 est.)
- exports of goods and services
- 68.5%
- government consumption
- 31.4%
- household consumption
- 68.7%
- imports of goods and services
- -90.9%
- investment in fixed capital
- 22.4%
- investment in inventories
- 0%
GDP - composition, by sector of origin
- agriculture
- 20.1%
- industry
- 25.7%
- services
- 54.2% (2014 est.)
GDP - per capita (PPP)
- $2,000 (2014 est.)
- $2,000 (2013 est.)
- $1,900 (2012 est.)
- note
- data are in 2014 US dollars
GDP - real growth rate
- 3.2% (2014 est.)
- 4.5% (2013 est.)
- 10.6% (2012 est.)
GDP (official exchange rate)
$13.67 billion (2014 est.)
GDP (purchasing power parity)
- $27.13 billion (2014 est.)
- $26.3 billion (2013 est.)
- $25.17 billion (2012 est.)
- note
- data are in 2014 US dollars
Gross national saving
- -9% of GDP (2014 est.)
- -12.5% of GDP (2013 est.)
- -11% of GDP (2012 est.)
Household income or consumption by percentage share
- highest 10%
- 40.4% (1995)
- lowest 10%
- 2%
Imports
- $5.135 billion (2014 est.)
- $4.571 billion (2013 est.)
Imports - commodities
machinery and transport equipment, other manufactures, chemicals, fuels, food products
Imports - partners
South Africa 49.7%, China 8.8%, Zambia 5.5%, India 4.3% (2014)
Industrial production growth rate
4.1% (2014 est.)
Industries
mining (coal, gold, platinum, copper, nickel, tin, diamonds, clay, numerous metallic and nonmetallic ores), steel; wood products, cement, chemicals, fertilizer, clothing and footwear, foodstuffs, beverages
Inflation rate (consumer prices)
- 0% (2014 est.)
- 1.6% (2013 est.)
Labor force
5.634 million (2014 est.)
Labor force - by occupation
- agriculture
- 66%
- industry
- 10%
- services
- 24% (1996)
Market value of publicly traded shares
- $4.073 billion (13 April 2015 est.)
- $11.82 billion (31 December 2012)
- $10.9 billion (31 December 2011 est.)
Population below poverty line
72.3% (2012 est.)
Public debt
- 181% of GDP (2014 est.)
- 181.2% of GDP (2013 est.)
Reserves of foreign exchange and gold
- $448 million (31 December 2014 est.)
- $475 million (31 December 2013 est.)
Stock of broad money
- $47.64 billion (31 December 2013 est.)
- $101.1 billion (31 December 2014 est.)
Stock of direct foreign investment - abroad
$NA
Stock of direct foreign investment - at home
$NA
Stock of domestic credit
- $14.07 billion (31 December 2013 est.)
- $9.844 billion (31 December 2012 est.)
Stock of narrow money
- $43.43 billion (31 December 2014 est.)
- $23.04 billion (31 December 2013 est.)
- note
- Zimbabwe's central bank no longer publishes data on monetary aggregates, except for bank deposits, which amounted to $2.1 billion in November 2010; the Zimbabwe dollar stopped circulating in early 2009; since then, the US dollar and South African rand have been the most frequently used currencies; there are no reliable estimates of the amount of foreign currency circulating in Zimbabwe
Taxes and other revenues
27.2% of GDP (2014)
Unemployment rate
- 95% (2009 est.)
- 80% (2005 est.)
- note
- figures include unemployment and underemployment; true unemployment is unknown and, under current economic conditions, unknowable
Energy
Carbon dioxide emissions from consumption of energy
10.12 million Mt (2012 est.)
Crude oil - exports
0 bbl/day (2010 est.)
Crude oil - imports
0 bbl/day (2010 est.)
Crude oil - production
120 bbl/day (2013 est.)
Crude oil - proved reserves
0 bbl (1 January 2014 est.)
Electricity - consumption
8.49 billion kWh (2011 est.)
Electricity - exports
1.085 billion kWh (2011 est.)
Electricity - from fossil fuels
62.1% of total installed capacity (2011 est.)
Electricity - from hydroelectric plants
37.9% of total installed capacity (2011 est.)
Electricity - from nuclear fuels
0% of total installed capacity (2011 est.)
Electricity - from other renewable sources
0% of total installed capacity (2011 est.)
Electricity - imports
2.616 billion kWh (2011 est.)
Electricity - installed generating capacity
1.966 million kW (2011 est.)
Electricity - production
7.297 billion kWh (2011 est.)
Natural gas - consumption
0 cu m (2012 est.)
Natural gas - exports
0 cu m (2012 est.)
Natural gas - imports
0 cu m (2012 est.)
Natural gas - production
0 cu m (2012 est.)
Natural gas - proved reserves
0 cu m (1 January 2014 est.)
Refined petroleum products - consumption
19,010 bbl/day (2013 est.)
Refined petroleum products - exports
0 bbl/day (2010 est.)
Refined petroleum products - imports
13,290 bbl/day (2010 est.)
Refined petroleum products - production
0 bbl/day (2010 est.)
Communications
Broadcast media
government owns all local radio and TV stations; foreign shortwave broadcasts and satellite TV are available to those who can afford antennas and receivers; in rural areas, access to TV broadcasts is extremely limited (2007)
Internet country code
.zw
Internet users
- percent of population
- 19.5% (2014 est.)
- total
- 2.7 million
Radio broadcast stations
AM 7, FM 20 (plus 17 repeater stations), shortwave 1 (1998)
Telephone system
- domestic
- consists of microwave radio relay links, open-wire lines, radiotelephone communication stations, fixed wireless local loop installations, and a substantial mobile-cellular network; Internet connection is available in Harare and planned for all major towns and for some of the smaller ones
- general assessment
- system was once one of the best in Africa, but now suffers from poor maintenance
- international
- country code - 263; satellite earth stations - 2 Intelsat; 2 international digital gateway exchanges (in Harare and Gweru) (2010)
Telephones - fixed lines
- subscriptions per 100 inhabitants
- 2 (2014 est.)
- total subscriptions
- 330,000
Telephones - mobile cellular
- subscriptions per 100 inhabitants
- 86 (2014 est.)
- total
- 11.8 million
Television broadcast stations
16 (1997)
Transportation
Airports
196 (2013)
Airports - with paved runways
- 1,524 to 2,437 m
- 5
- 2,438 to 3,047 m
- 2
- 914 to 1,523 m
- 7 (2013)
- over 3,047 m
- 3
- total
- 17
Airports - with unpaved runways
- 72 (2013)
- 1,524 to 2,437 m
- 3
- 914 to 1,523 m
- 104
- total
- 179
Pipelines
refined products 270 km (2013)
Ports and terminals
- river port(s)
- Binga, Kariba (Zambezi)
Railways
- narrow gauge
- 3,427 km 1.067-m gauge (313 km electrified) (2014)
- total
- 3,427 km
Roadways
- paved
- 18,481 km
- total
- 97,267 km
- unpaved
- 78,786 km (2002)
Waterways
(some navigation possible on Lake Kariba) (2011)
Military and Security
Manpower available for military service
- females age 16-49
- 2,868,376 (2010 est.)
- males age 16-49
- 2,616,051
Manpower fit for military service
- females age 16-49
- 1,646,041 (2010 est.)
- males age 16-49
- 1,528,166
Manpower reaching militarily significant age annually
- female
- 152,550 (2010 est.)
- male
- 154,870
Military branches
Zimbabwe Defense Forces (ZDF): Zimbabwe National Army (ZNA), Air Force of Zimbabwe (AFZ) (2012)
Military expenditures
- 2.79% of GDP (2014)
- 2.64% of GDP (2013)
- 2.94% of GDP (2012)
- 2.05% of GDP (2011)
- 2.94% of GDP (2010)
Military service age and obligation
18-24 years of age for voluntary military service; no conscription; women are eligible to serve (2012)
Transnational Issues
Disputes - international
Namibia has supported, and in 2004 Zimbabwe dropped objections to, plans between Botswana and Zambia to build a bridge over the Zambezi River, thereby de facto recognizing a short, but not clearly delimited, Botswana-Zambia boundary in the river; South Africa has placed military units to assist police operations along the border of Lesotho, Zimbabwe, and Mozambique to control smuggling, poaching, and illegal migration
Illicit drugs
transit point for cannabis and South Asian heroin, mandrax, and methamphetamines en route to South Africa
Refugees and internally displaced persons
- IDPs
- undetermined (political violence, violence in association with the 2008 election, human rights violations, land reform, and economic collapse) (2015)
Trafficking in persons
- current situation
- Zimbabwe is a source, transit, and destination country for men, women, and children subjected to forced labor and sex trafficking; Zimbabwean women and girls from towns bordering South Africa, Mozambique, and Zambia are subjected to prostitution, sometimes being sold by their parents; Zimbabwean men, women, and children experience forced labor in agriculture and domestic service in rural areas, as well as domestic servitude and sex trafficking in cities and towns; Zimbabwean women and men are lured into exploitative labor situations in Angola, Botswana, Mozambique, the United Arab Emirates, Malaysia, Nigeria, South Korea, and South Africa with false job offers, while women and girls are lured to Zambia, China, Egypt, the UK, and Canada and forced into prostitution; adults and children from Bangladesh, Somalia, India, Pakistan, the Democratic Republic of the Congo, Malawi, Mozambique, and Zambia are trafficked through Zimbabwe en route to South Africa
- tier rating
- Tier 3 - Zimbabwe does not fully comply with the minimum standards for the elimination of trafficking and is not making significant efforts to do so; corruption in law enforcement and the judiciary continued to impair anti-trafficking efforts in 2013; the investigation and prosecution of trafficking offenses and conviction of offenders remained weak, with only two prosecutions being initiated; law enforcement did not employ formal procedures to identify and refer trafficking victims to care and continued to rely on NGOs to identify and assist victims; temporary regulations in 2014 mandated the creation of an anti-trafficking national action plan and the establishment of centers for trafficking victims, but neither have been implemented; Zimbabwe acceded to the UN TIP Protocol in 2013 (2014)