2012 Edition
CIA World Factbook 2012 Archive (HTML)
Introduction
Background
Dutch traders landed at the southern tip of modern day South Africa in 1652 and established a stopover point on the spice route between the Netherlands and the Far East, founding the city of Cape Town. After the British seized the Cape of Good Hope area in 1806, many of the Dutch settlers (the Boers) trekked north to found their own republics. The discovery of diamonds (1867) and gold (1886) spurred wealth and immigration and intensified the subjugation of the native inhabitants. The Boers resisted British encroachments but were defeated in the Boer War (1899-1902); however, the British and the Afrikaners, as the Boers became known, ruled together beginning in 1910 under the Union of South Africa, which became a republic in 1961 after a whites-only referendum. In 1948, the National Party was voted into power and instituted a policy of apartheid - the separate development of the races - which favored the white minority at the expense of the black majority. The African National Congress (ANC) led the opposition to apartheid and many top ANC leaders, such as Nelson MANDELA, spent decades in South Africa's prisons. Internal protests and insurgency, as well as boycotts by some Western nations and institutions, led to the regime's eventual willingness to negotiate a peaceful transition to majority rule. The first multi-racial elections in 1994 brought an end to apartheid and ushered in majority rule under an ANC-led government. South Africa since then has struggled to address apartheid-era imbalances in decent housing, education, and health care. ANC infighting, which has grown in recent years, came to a head in September 2008 when President Thabo MBEKI resigned, and Kgalema MOTLANTHE, the party's General-Secretary, succeeded him as interim president. Jacob ZUMA became president after the ANC won general elections in April 2009. In January 2011, South Africa assumed a nonpermanent seat on the UN Security Council for the 2011-12 term.
Geography
Area
- 1,219,090 sq km 1,214,470 sq km 4,620 sq km includes Prince Edward Islands (Marion Island and Prince Edward Island)
- total
- 1,219,090 sq km
- water
- 4,620 sq km
Area - comparative
slightly less than twice the size of Texas
Climate
mostly semiarid; subtropical along east coast; sunny days, cool nights
Coastline
2,798 km
Elevation extremes
- Atlantic Ocean 0 m Njesuthi 3,408 m
- highest point
- Njesuthi 3,408 m
- lowest point
- Atlantic Ocean 0 m
Environment - current issues
lack of important arterial rivers or lakes requires extensive water conservation and control measures; growth in water usage outpacing supply; pollution of rivers from agricultural runoff and urban discharge; air pollution resulting in acid rain; soil erosion; desertification
Environment - international agreements
- Antarctic-Environmental Protocol, Antarctic-Marine Living Resources, Antarctic Seals, Antarctic Treaty, Biodiversity, Climate Change, Climate Change-Kyoto Protocol, Desertification, Endangered Species, Hazardous Wastes, Law of the Sea, Marine Dumping, Marine Life Conservation, Ozone Layer Protection, Ship Pollution, Wetlands, Whaling none of the selected agreements
- party to
- Antarctic-Environmental Protocol, Antarctic-Marine Living Resources, Antarctic Seals, Antarctic Treaty, Biodiversity, Climate Change, Climate Change-Kyoto Protocol, Desertification, Endangered Species, Hazardous Wastes, Law of the Sea, Marine Dumping, Marine Life Conservation, Ozone Layer Protection, Ship Pollution, Wetlands, Whaling
- signed, but not ratified
- none of the selected agreements
Freshwater withdrawal (domestic/industrial/agricultural)
- 12.5 cu km/yr (31%/6%/63%) 264 cu m/yr (2000)
- per capita
- 264 cu m/yr (2000)
- total
- 12.5 cu km/yr (31%/6%/63%)
Geographic coordinates
29 00 S, 24 00 E
Geography - note
South Africa completely surrounds Lesotho and almost completely surrounds Swaziland
Irrigated land
14,980 sq km (2003)
Land boundaries
- 4,862 km Botswana 1,840 km, Lesotho 909 km, Mozambique 491 km, Namibia 967 km, Swaziland 430 km, Zimbabwe 225 km
- border countries
- Botswana 1,840 km, Lesotho 909 km, Mozambique 491 km, Namibia 967 km, Swaziland 430 km, Zimbabwe 225 km
- total
- 4,862 km
Land use
- 12.1% 0.79% 87.11% (2005)
- arable land
- 12.1%
- other
- 87.11% (2005)
- permanent crops
- 0.79%
Location
Southern Africa, at the southern tip of the continent of Africa
Map references
Africa
Maritime claims
- 12 nm 24 nm 200 nm 200 nm or to edge of the continental margin
- contiguous zone
- 24 nm
- continental shelf
- 200 nm or to edge of the continental margin
- exclusive economic zone
- 200 nm
- territorial sea
- 12 nm
Natural hazards
- prolonged droughts the volcano forming Marion Island in the Prince Edward Islands, which last erupted in 2004, is South Africa's only active volcano
- volcanism
- the volcano forming Marion Island in the Prince Edward Islands, which last erupted in 2004, is South Africa's only active volcano
Natural resources
gold, chromium, antimony, coal, iron ore, manganese, nickel, phosphates, tin, rare earth elements, uranium, gem diamonds, platinum, copper, vanadium, salt, natural gas
Terrain
vast interior plateau rimmed by rugged hills and narrow coastal plain
Total renewable water resources
50 cu km (1990)
People and Society
Age structure
- 28.4% (male 6,955,602/ female 6,914,246) 65.7% (male 16,172,553/ female 15,902,889) 5.9% (male 1,151,510/ female 1,713,627) (2012 est.)
- 0-14 years
- 28.4% (male 6,955,602/ female 6,914,246)
- 15-64 years
- 65.7% (male 16,172,553/ female 15,902,889)
- 65 years and over
- 5.9% (male 1,151,510/ female 1,713,627) (2012 est.)
Birth rate
19.32 births/1,000 population (2012 est.)
Death rate
17.23 deaths/1,000 population (July 2012 est.)
Education expenditures
5.4% of GDP (2009)
Ethnic groups
black African 79%, white 9.6%, colored 8.9%, Indian/Asian 2.5% (2001 census)
Health expenditures
8.5% of GDP (2009)
HIV/AIDS - adult prevalence rate
17.8% (2009 est.)
HIV/AIDS - deaths
310,000 (2009 est.)
HIV/AIDS - people living with HIV/AIDS
5.6 million (2009 est.)
Hospital bed density
2.84 beds/1,000 population (2005)
Infant mortality rate
- 42.67 deaths/1,000 live births 46.54 deaths/1,000 live births 38.73 deaths/1,000 live births (2012 est.)
- female
- 38.73 deaths/1,000 live births (2012 est.)
- total
- 42.67 deaths/1,000 live births
Languages
IsiZulu (official) 23.82%, IsiXhosa (official) 17.64%, Afrikaans (official) 13.35%, Sepedi (offcial) 9.39%, English (official) 8.2%, Setswana (official) 8.2%, Sesotho (official) 7.93%, Xitsonga (official) 4.44%, siSwati (official) 2.66%, Tshivenda (official) 2.28%, isiNdebele (official) 1.59%, other 0.5% (2001 census)
Life expectancy at birth
- 49.41 years 50.34 years 48.45 years (2012 est.)
- female
- 48.45 years (2012 est.)
- total population
- 49.41 years
Literacy
- age 15 and over can read and write 86.4% 87% 85.7% (2003 est.)
- definition
- age 15 and over can read and write
- female
- 85.7% (2003 est.)
- male
- 87%
- total population
- 86.4%
Major cities - population
Johannesburg 3.607 million; Cape Town 3.353 million; Ekurhuleni (East Rand) 3.144 million; Durban 2.837 million; PRETORIA (capital) 1.404 million (2009)
Major infectious diseases
- intermediate bacterial diarrhea, hepatitis A, and typhoid fever schistosomiasis (2009)
- degree of risk
- intermediate
- food or waterborne diseases
- bacterial diarrhea, hepatitis A, and typhoid fever
- water contact disease
- schistosomiasis (2009)
Maternal mortality rate
300 deaths/100,000 live births (2010)
Median age
- 25.3 years 25 years 25.6 years (2012 est.)
- female
- 25.6 years (2012 est.)
- male
- 25 years
- total
- 25.3 years
Nationality
- South African(s) South African
- adjective
- South African
- noun
- South African(s)
Net migration rate
-6.22 migrant(s)/1,000 population there is an increasing flow of Zimbabweans into South Africa and Botswana in search of better economic opportunities (2012 est.)
Physicians density
0.77 physicians/1,000 population (2004)
Population
48,810,427 (July 2012 est.) estimates for this country explicitly take into account the effects of excess mortality due to AIDS; this can result in lower life expectancy, higher infant mortality, higher death rates, lower population growth rates, and changes in the distribution of population by age and sex than would otherwise be expected
Population growth rate
-0.412% (2012 est.)
Religions
Protestant 36.6% (Zionist Christian 11.1%, Pentecostal/Charismatic 8.2%, Methodist 6.8%, Dutch Reformed 6.7%, Anglican 3.8%), Catholic 7.1%, Muslim 1.5%, other Christian 36%, other 2.3%, unspecified 1.4%, none 15.1% (2001 census)
Sanitation facility access
- urban: 84% of population rural: 65% of population total: 77% of population urban: 16% of population rural: 35% of population total: 23% of population
- rural
- 35% of population
- total
- 23% of population
- urban
- 16% of population
School life expectancy (primary to tertiary education)
- 13 years 13 years 13 years (2004)
- female
- 13 years (2004)
- male
- 13 years
- total
- 13 years
Sex ratio
- 1.02 male(s)/female 1.01 male(s)/female 1.02 male(s)/female 0.67 male(s)/female 0.99 male(s)/female (2011 est.)
- 15-64 years
- 1.02 male(s)/female
- 65 years and over
- 0.67 male(s)/female
- at birth
- 1.02 male(s)/female
- total population
- 0.99 male(s)/female (2011 est.)
- under 15 years
- 1.01 male(s)/female
Total fertility rate
2.28 children born/woman (2012 est.)
Unemployment, youth ages 15-24
- 48.2% 44.6% 52.5% (2009)
- female
- 52.5% (2009)
- total
- 48.2%
Urbanization
- 62% of total population (2010) 1.2% annual rate of change (2010-15 est.)
- rate of urbanization
- 1.2% annual rate of change (2010-15 est.)
- urban population
- 62% of total population (2010)
Government
Administrative divisions
9 provinces; Eastern Cape, Free State, Gauteng, KwaZulu-Natal, Limpopo, Mpumalanga, Northern Cape, North-West, Western Cape
Capital
- Pretoria (administrative capital) 25 42 S, 28 13 E UTC+2 (7 hours ahead of Washington, DC during Standard Time) Cape Town (legislative capital); Bloemfontein (judicial capital)
- geographic coordinates
- 25 42 S, 28 13 E
- name
- Pretoria (administrative capital)
- time difference
- UTC+2 (7 hours ahead of Washington, DC during Standard Time)
Constitution
10 December 1996; note - certified by the Constitutional Court 4 December 1996; was signed by then President MANDELA 10 December 1996; and entered into effect 4 February 1997
Country name
- Republic of South Africa South Africa Union of South Africa RSA
- abbreviation
- RSA
- conventional long form
- Republic of South Africa
- conventional short form
- South Africa
- former
- Union of South Africa
Diplomatic representation from the US
- Ambassador Donald H. GIPS 877 Pretorius Street, Pretoria P. O. Box 9536, Pretoria 0001 [27] (12) 431-4000 [27] (12) 342-2299 Cape Town, Durban, Johannesburg
- chief of mission
- Ambassador Donald H. GIPS
- consulate(s) general
- Cape Town, Durban, Johannesburg
- embassy
- 877 Pretorius Street, Pretoria
- FAX
- [27] (12) 342-2299
- mailing address
- P. O. Box 9536, Pretoria 0001
- telephone
- [27] (12) 431-4000
Diplomatic representation in the US
- Ambassador Ebrahim RASOOL 3051 Massachusetts Avenue NW, Washington, DC 20008 [1] (202) 232-4400 [1] (202) 265-1607 Chicago, Los Angeles, New York
- chancery
- 3051 Massachusetts Avenue NW, Washington, DC 20008
- chief of mission
- Ambassador Ebrahim RASOOL
- consulate(s) general
- Chicago, Los Angeles, New York
- FAX
- [1] (202) 265-1607
- telephone
- [1] (202) 232-4400
Executive branch
- President Jacob ZUMA (since 9 May 2009); Deputy President Kgalema MOTLANTHE (since 11 May 2009); note - the president is both the chief of state and head of government President Jacob ZUMA (since 9 May 2009); Deputy President Kgalema MOTLANTHE (since 11 May 2009) Cabinet appointed by the president president elected by the National Assembly for a five-year term (eligible for a second term); election last held on 6 May 2009 (next to be held in 2014) Jacob ZUMA elected president; National Assembly vote - Jacob ZUMA 277, Mvume DANDALA 47, other 76
- cabinet
- Cabinet appointed by the president
- chief of state
- President Jacob ZUMA (since 9 May 2009); Deputy President Kgalema MOTLANTHE (since 11 May 2009); note - the president is both the chief of state and head of government
- election results
- Jacob ZUMA elected president; National Assembly vote - Jacob ZUMA 277, Mvume DANDALA 47, other 76
- elections
- president elected by the National Assembly for a five-year term (eligible for a second term); election last held on 6 May 2009 (next to be held in 2014)
- head of government
- President Jacob ZUMA (since 9 May 2009); Deputy President Kgalema MOTLANTHE (since 11 May 2009)
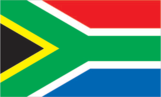
Flag description
two equal width horizontal bands of red (top) and blue separated by a central green band that splits into a horizontal Y, the arms of which end at the corners of the hoist side; the Y embraces a black isosceles triangle from which the arms are separated by narrow yellow bands; the red and blue bands are separated from the green band and its arms by narrow white stripes; the flag colors do not have any official symbolism, but the Y stands for the "convergence of diverse elements within South African society, taking the road ahead in unity"; black, yellow, and green are found on the flag of the African National Congress, while red, white, and blue are the colors in the flags of the Netherlands and the UK, whose settlers ruled South Africa during the colonial era the South African flag is one of only two national flags to display six colors as part of its primary design, the other is South Sudan's
Government type
republic
Independence
- 31 May 1910 (Union of South Africa formed from four British colonies: Cape Colony, Natal, Transvaal, and Orange Free State); 31 May 1961 (republic declared); 27 April 1994 (majority rule)
- 31 May 1910 (Union of South Africa formed from four British colonies
- Cape Colony, Natal, Transvaal, and Orange Free State); 31 May 1961 (republic declared); 27 April 1994 (majority rule)
International law organization participation
has not submitted an ICJ jurisdiction declaration; accepts ICCt jurisdiction
International organization participation
ACP, AfDB, AU, BIS, BRICS, C, CD, FAO, FATF, G-20, G-24, G-77, IAEA, IBRD, ICAO, ICC (national committees), ICRM, IDA, IFAD, IFC, IFRCS, IHO, ILO, IMF, IMO, IMSO, Interpol, IOC, IOM, IPU, ISO, ITSO, ITU, ITUC (NGOs), MIGA, MONUSCO, NAM, NSG, OECD (Enhanced Engagement, OPCW, Paris Club (associate), PCA, SACU, SADC, UN, UNAMID, UNCTAD, UNESCO, UNHCR, UNIDO, UNITAR, UNSC (temporary), UNWTO, UPU, WCO, WFTU (NGOs), WHO, WIPO, WMO, WTO, ZC
Judicial branch
Constitutional Court; Supreme Court of Appeals; High Courts; Magistrate Courts
Legal system
mixed legal system of Roman-Dutch civil law, English common law, and customary law
Legislative branch
- bicameral Parliament consisting of the National Council of Provinces (90 seats; 10 members elected by each of the nine provincial legislatures for five-year terms; has special powers to protect regional interests, including the safeguarding of cultural and linguistic traditions among ethnic minorities) and the National Assembly (400 seats; members elected by popular vote under a system of proportional representation to serve five-year terms) National Assembly and National Council of Provinces - last held on 22 April 2009 (next to be held in April 2014) National Council of Provinces - percent of vote by party - NA; seats by party - NA; National Assembly - percent of vote by party - ANC 65.9%, DA 16.7%, COPE 7.4%, IFP 4.6%, other 5.4%; seats by party - ANC 264, DA 67, COPE 30, IFP 18, other 21
- election results
- National Council of Provinces - percent of vote by party - NA; seats by party - NA; National Assembly - percent of vote by party - ANC 65.9%, DA 16.7%, COPE 7.4%, IFP 4.6%, other 5.4%; seats by party - ANC 264, DA 67, COPE 30, IFP 18, other 21
- elections
- National Assembly and National Council of Provinces - last held on 22 April 2009 (next to be held in April 2014)
National anthem
- "National Anthem of South Africa" Enoch SONTONGA and Cornelius Jacob LANGENHOVEN/Enoch SONTONGA and Marthinus LOURENS de Villiers adopted 1994; the anthem is a combination of "N'kosi Sikelel' iAfrica" (God Bless Africa) and "Die Stem van Suid Afrika" (The Call of South Africa), which were respectively the anthems of the non-white and white communities under apartheid; the official lyrics contain a mixture of Xhosa, Zulu, Sesotho, Afrikaans, and English; the music incorporates the melody used in the Tanzanian and Zambian anthems
- lyrics/music
- Enoch SONTONGA and Cornelius Jacob LANGENHOVEN/Enoch SONTONGA and Marthinus LOURENS de Villiers
- name
- "National Anthem of South Africa"
National holiday
Freedom Day, 27 April (1994)
National symbol(s)
springbok antelope
Political parties and leaders
African Christian Democratic Party or ACDP [Kenneth MESHOE]; African National Congress or ANC [Jacob ZUMA]; Congress of the People or COPE [Mosiuoa LEKOTA]; Democratic Alliance or DA [Helen ZILLE]; Freedom Front Plus or FF+ [Pieter MULDER]; Inkatha Freedom Party or IFP [Mangosuthu BUTHELEZI]; Pan-Africanist Congress or PAC [Motsoko PHEKO]; United Christian Democratic Party or UCDP [Lucas MANGOPE]; United Democratic Movement or UDM [Bantu HOLOMISA]
Political pressure groups and leaders
Congress of South African Trade Unions or COSATU [Zwelinzima VAVI, general secretary]; South African Communist Party or SACP [Blade NZIMANDE, general secretary]; South African National Civics Organization or SANCO [Mlungisi HLONGWANE, national president] note - COSATU and SACP are in a formal alliance with the ANC
Suffrage
18 years of age; universal
Economy
Agriculture - products
corn, wheat, sugarcane, fruits, vegetables; beef, poultry, mutton, wool, dairy products
Budget
- $95.27 billion $116.5 billion (2012 est.)
- expenditures
- $116.5 billion (2012 est.)
- revenues
- $95.27 billion
Budget surplus (+) or deficit (-)
-5.4% of GDP (2012 est.)
Central bank discount rate
7% (31 December 2009) 11.5% (31 December 2008)
Commercial bank prime lending rate
8.8% (31 December 2012 est.) 9% (31 December 2011 est.)
Current account balance
-$21.33 billion (2012 est.) -$13.68 billion (2011 est.)
Debt - external
$47.56 billion (31 December 2012 est.) $47.49 billion (31 December 2011 est.)
Distribution of family income - Gini index
65 (2005) 59.3 (1994)
Economy - overview
South Africa is a middle-income, emerging market with an abundant supply of natural resources; well-developed financial, legal, communications, energy, and transport sectors; a stock exchange that is the 18th largest in the world; and modern infrastructure supporting a relatively efficient distribution of goods to major urban centers throughout the region. Growth was robust from 2004 to 2007 as South Africa reaped the benefits of macroeconomic stability and a global commodities boom but began to slow in the second half of 2007 due to an electricity crisis and the subsequent global financial crisis' impact on commodity prices and demand. GDP fell nearly 2% in 2009 but recovered in 2010-12. Unemployment remains high, at nearly one-quarter of the work force, and outdated infrastructure has constrained growth. State power supplier Eskom encountered problems with aging plants and meeting electricity demand necessitating "load-shedding" cuts in 2007 and 2008 to residents and businesses in the major cities. Daunting economic problems remain from the apartheid era - especially poverty, lack of economic empowerment among the disadvantaged groups, and a shortage of public transportation. South Africa's economic policy focuses on controlling inflation, however, the country has had significant budget deficits that hamper its ability to deal with pressing economic problems. The current government must contend with the impact of the global crisis and is facing growing pressure from special interest groups to use state-owned enterprises to deliver basic services to low-income areas and to increase job growth.
Exchange rates
rand (ZAR) per US dollar - 8.095 (2012 est.) 7.2597 (2011 est.) 7.3212 (2010 est.) 8.42 (2009) 7.9576 (2008)
Exports
$101.2 billion (2012 est.) $102.9 billion (2011 est.)
Exports - commodities
gold, diamonds, platinum, other metals and minerals, machinery and equipment
Exports - partners
China 12.7%, US 8.6%, Japan 7.9%, Germany 6%, UK 4.1% (2011)
Fiscal year
1 April - 31 March
GDP - composition by sector
- 2.4% 32.1% 64.9% (2012 est.)
- agriculture
- 2.4%
- industry
- 32.1%
- services
- 64.9% (2012 est.)
GDP - per capita (PPP)
$11,300 (2012 est.) $11,100 (2011 est.) $10,900 (2010 est.) data are in 2012 US dollars
GDP - real growth rate
2.6% (2012 est.) 3.1% (2011 est.) 2.9% (2010 est.)
GDP (official exchange rate)
$390.9 billion (2012 est.)
GDP (purchasing power parity)
$578.6 billion (2012 est.) $564 billion (2011 est.) $546.9 billion (2010 est.) data are in 2012 US dollars
Household income or consumption by percentage share
- 1.2% 51.7% (2009 est.)
- highest 10%
- 51.7% (2009 est.)
- lowest 10%
- 1.2%
Imports
$106.8 billion (2012 est.) $100.4 billion (2011 est.)
Imports - commodities
machinery and equipment, chemicals, petroleum products, scientific instruments, foodstuffs
Imports - partners
China 14.3%, Germany 10.7%, US 8%, Japan 4.7%, Saudi Arabia 4.5%, India 4%, UK 4% (2011)
Industrial production growth rate
2.5% (2011 est.)
Inflation rate (consumer prices)
5.2% (2012 est.) 5% (2011 est.)
Investment (gross fixed)
19.5% of GDP (2012 est.)
Labor force
17.89 million (2012 est.)
Labor force - by occupation
- 9% 26% 65% (2007 est.)
- agriculture
- 9%
- industry
- 26%
- services
- 65% (2007 est.)
Market value of publicly traded shares
$855.7 billion (31 December 2011) $1.013 trillion (31 December 2010) $704.8 billion (31 December 2009)
Population below poverty line
50% (2000 est.)
Public debt
43.3% of GDP (2012 est.) 38.6% of GDP (2011 est.)
Reserves of foreign exchange and gold
$54.98 billion (31 December 2012 est.) $48.87 billion (31 December 2011 est.)
Stock of broad money
$277 billion (31 December 2011 est.) $314.1 billion (31 December 2010 est.)
Stock of direct foreign investment - abroad
$88.59 billion (31 December 2012 est.) $88.95 billion (31 December 2011 est.)
Stock of direct foreign investment - at home
$162.9 billion (31 December 2012 est.) $158.9 billion (31 December 2011 est.)
Stock of domestic credit
$287.9 billion (31 December 2012 est.) $284.7 billion (31 December 2011 est.)
Stock of narrow money
$117 billion (31 December 2012 est.) $117.3 billion (31 December 2011 est.)
Taxes and other revenues
24.4% of GDP (2012 est.)
Unemployment rate
24.4% (2012 est.) 24.9% (2011 est.)
Energy
Carbon dioxide emissions from consumption of energy
465.1 million Mt (2010 est.)
Crude oil - exports
0 bbl/day (2009 est.)
Crude oil - imports
402,300 bbl/day (2009 est.)
Crude oil - production
169,000 bbl/day (2011 est.)
Crude oil - proved reserves
15 million bbl (1 January 2012 est.)
Electricity - consumption
206.1 billion kWh (2009 est.)
Electricity - exports
14.65 billion kWh (2010 est.)
Electricity - from fossil fuels
90.8% of total installed capacity (2009 est.)
Electricity - from hydroelectric plants
1.5% of total installed capacity (2009 est.)
Electricity - from nuclear fuels
4.1% of total installed capacity (2009 est.)
Electricity - from other renewable sources
0.5% of total installed capacity (2009 est.)
Electricity - imports
12.19 billion kWh (2010 est.)
Electricity - installed generating capacity
44.26 million kW (2009 est.)
Electricity - production
232.1 billion kWh (2009 est.)
Natural gas - consumption
4.01 billion cu m (2010 est.)
Natural gas - exports
0 cu m (2010 est.)
Natural gas - imports
3.04 billion cu m (2010 est.)
Natural gas - production
970 million cu m (2010 est.)
Natural gas - proved reserves
27.16 million cu m (1 January 2006 est.)
Refined petroleum products - consumption
590,900 bbl/day (2011 est.)
Refined petroleum products - exports
49,430 bbl/day (2008 est.)
Refined petroleum products - imports
60,290 bbl/day (2008 est.)
Refined petroleum products - production
516,100 bbl/day (2008 est.)
Communications
Broadcast media
the South African Broadcasting Corporation (SABC) operates 4 TV stations, 3 are free-to-air and 1 is pay TV; e.tv, a private station, is accessible to more than half the population; multiple subscription TV services provide a mix of local and international channels; well developed mix of public and private radio stations at the national, regional, and local levels; the SABC radio network, state-owned and controlled but nominally independent, operates 18 stations, one for each of the 11 official languages, 4 community stations, and 3 commercial stations; more than 100 community-based stations extend coverage to rural areas (2007)
Internet country code
.za
Internet hosts
4.761 million (2012)
Internet users
4.42 million (2009)
Telephone system
- the system is the best developed and most modern in Africa combined fixed-line and mobile-cellular teledensity roughly 140 telephones per 100 persons; consists of carrier-equipped open-wire lines, coaxial cables, microwave radio relay links, fiber-optic cable, radiotelephone communication stations, and wireless local loops; key centers are Bloemfontein, Cape Town, Durban, Johannesburg, Port Elizabeth, and Pretoria country code - 27; the SAT-3/WASC and SAFE fiber-optic submarine cable systems connect South Africa to Europe and Asia; the EASSy fiber-optic cable system connects with Europe and North America; satellite earth stations - 3 Intelsat (1 Indian Ocean and 2 Atlantic Ocean)
- domestic
- combined fixed-line and mobile-cellular teledensity roughly 140 telephones per 100 persons; consists of carrier-equipped open-wire lines, coaxial cables, microwave radio relay links, fiber-optic cable, radiotelephone communication stations, and wireless local loops; key centers are Bloemfontein, Cape Town, Durban, Johannesburg, Port Elizabeth, and Pretoria
- general assessment
- the system is the best developed and most modern in Africa
- international
- country code - 27; the SAT-3/WASC and SAFE fiber-optic submarine cable systems connect South Africa to Europe and Asia; the EASSy fiber-optic cable system connects with Europe and North America; satellite earth stations - 3 Intelsat (1 Indian Ocean and 2 Atlantic Ocean)
Telephones - main lines in use
4.127 million (2011)
Telephones - mobile cellular
64 million (2011)
Transportation
Airports
567 (2012)
Airports - with paved runways
- 9 (2012)
- 1,524 to 2,437 m
- 53
- 2,438 to 3,047 m
- 6
- 914 to 1,523 m
- 66
- over 3,047 m
- 11
- total
- 145
- under 914 m
- 9 (2012)
Airports - with unpaved runways
- 132 (2012)
- 1,524 to 2,437 m
- 29
- 2,438 to 3,047 m
- 1
- 914 to 1,523 m
- 260
- total
- 422
- under 914 m
- 132 (2012)
Heliports
1 (2012)
Merchant marine
- petroleum tanker 3 19 (Australia 1, Isle of Man 2, Mexico 1, NZ 1, Seychelles 1, Singapore 13) (2010)
- registered in other countries
- 19 (Australia 1, Isle of Man 2, Mexico 1, NZ 1, Seychelles 1, Singapore 13) (2010)
- total
- 3
Pipelines
condensate 11 km; gas 908 km; oil 980 km; refined products 1,382 km (2010)
Ports and terminals
Cape Town, Durban, Port Elizabeth, Richards Bay, Saldanha Bay
Railways
- 20,192 km 19,756 km 1.065-m gauge (8,271 km electrified); 122 km 0.750-m gauge; 314 km 0.610-m gauge (2008)
- total
- 20,192 km
Roadways
- 362,099 km 73,506 km (includes 239 km of expressways) 288,593 km (2002)
- total
- 362,099 km
- unpaved
- 288,593 km (2002)
Military and Security
Manpower available for military service
- 13,439,781 12,473,641 (2010 est.)
- females age 16-49
- 12,473,641 (2010 est.)
- males age 16-49
- 13,439,781
Manpower fit for military service
- 7,617,063 6,476,264 (2010 est.)
- females age 16-49
- 6,476,264 (2010 est.)
- males age 16-49
- 7,617,063
Manpower reaching militarily significant age annually
- 482,122 485,017 (2010 est.)
- female
- 485,017 (2010 est.)
- male
- 482,122
Military - note
with the end of apartheid and the establishment of majority rule, former military, black homelands forces, and ex-opposition forces were integrated into the South African National Defense Force (SANDF); as of 2003 the integration process was considered complete
Military branches
- South African National Defense Force (SANDF): South African Army, South African Navy (SAN), South African Air Force (SAAF), Joint Operations Command, Military Intelligence, South African Military Health Services (2009)
- South African National Defense Force (SANDF)
- South African Army, South African Navy (SAN), South African Air Force (SAAF), Joint Operations Command, Military Intelligence, South African Military Health Services (2009)
Military expenditures
1.7% of GDP (2006)
Military service age and obligation
18 years of age for voluntary military service; women are eligible to serve in noncombat roles; 2-year service obligation (2007)
Transnational Issues
Disputes - international
South Africa has placed military along the border to apprehend the thousands of Zimbabweans fleeing economic dysfunction and political persecution; as of January 2007, South Africa also supports large numbers of refugees and asylum seekers from the Democratic Republic of the Congo (33,000), Somalia (20,000), Burundi (6,500), and other states in Africa (26,000); managed dispute with Namibia over the location of the boundary in the Orange River; in 2006, Swazi king advocates resort to ICJ to claim parts of Mpumalanga and KwaZulu-Natal from South Africa
Illicit drugs
transshipment center for heroin, hashish, and cocaine, as well as a major cultivator of marijuana in its own right; cocaine and heroin consumption on the rise; world's largest market for illicit methaqualone, usually imported illegally from India through various east African countries, but increasingly producing its own synthetic drugs for domestic consumption; attractive venue for money launderers given the increasing level of organized criminal and narcotics activity in the region and the size of the South African economy
Refugees and internally displaced persons
- 12,973 (Democratic Republic of Congo); 15,186 (Somalia); 5,808 (Angola) (2011)
- refugees (country of origin)
- 12,973 (Democratic Republic of Congo); 15,186 (Somalia); 5,808 (Angola) (2011)