2018 Edition
CIA World Factbook 2018 Archive (Wayback Machine)
Introduction
Background
Established in 1891, the British protectorate of Nyasaland became the independent nation of Malawi in 1964. After three decades of one-party rule under President Hastings Kamuzu BANDA, the country held multiparty presidential and parliamentary elections in 1994, under a provisional constitution that came into full effect the following year. Bakili MULUZI became the first freely elected president of Malawi when he won the presidency in 1994; he won re-election in 1999. President Bingu wa MUTHARIKA, elected in 2004 after a failed attempt by the previous president to amend the constitution to permit another term, struggled to assert his authority against his predecessor and subsequently started his own party, the Democratic Progressive Party in 2005. MUTHARIKA was reelected to a second term in 2009. He oversaw some economic improvement in his first term, but was accused of economic mismanagement and poor governance in his second term. He died abruptly in 2012 and was succeeded by vice president, Joyce BANDA, who had earlier started her own party, the People's Party. MUTHARIKA's brother, Peter MUTHARIKA, defeated BANDA in the 2014 election. Population growth, increasing pressure on agricultural lands, corruption, and the scourge of HIV/AIDS pose major problems for Malawi.
Geography
Area
- land
- 94,080 sq km
- total
- 118,484 sq km
- water
- 24,404 sq km
Area Comparative
slightly smaller than Pennsylvania
Climate
sub-tropical; rainy season (November to May); dry season (May to November)
Coastline
0 km (landlocked)
Elevation
- elevation extremes
- 37 m lowest point: junction of the Shire River and international boundary with Mozambique
- mean elevation
- 779 m
- note
- 3002 highest point: Sapitwa (Mount Mlanje)
Environment Current Issues
deforestation; land degradation; water pollution from agricultural runoff, sewage, industrial wastes; siltation of spawning grounds endangers fish populations; negative effects of climate change (extreme high temperatures, changing precipatation pattens)
Environment International Agreements
- party to
- Biodiversity, Climate Change, Climate Change-Kyoto Protocol, Desertification, Endangered Species, Environmental Modification, Hazardous Wastes, Marine Life Conservation, Ozone Layer Protection, Ship Pollution, Wetlands
- signed, but not ratified
- Law of the Sea
Geographic Coordinates
13 30 S, 34 00 E
Geography Note
landlocked; Lake Nyasa, some 580 km long, is the country's most prominent physical feature; it contains more fish species than any other lake on earth
Irrigated Land
740 sq km (2012)
Land Boundaries
- border countries (3)
- Mozambique 1498 km, Tanzania 512 km, Zambia 847 km
- total
- 2,857 km
Land Use
- arable land: 38.2% (2011 est.) / permanent crops: 1.4% (2011 est.) / permanent pasture: 19.6% (2011 est.)
- agricultural land
- 59.2% (2011 est.)
- forest
- 34% (2011 est.)
- other
- 6.8% (2011 est.)
Location
Southern Africa, east of Zambia, west and north of Mozambique
Map References
Africa
Maritime Claims
- note
- none (landlocked)
Natural Hazards
flooding; droughts; earthquakes
Natural Resources
limestone, arable land, hydropower, unexploited deposits of uranium, coal, and bauxite
Population Distribution
population density is highest south of Lake Nyasa
Terrain
narrow elongated plateau with rolling plains, rounded hills, some mountains
People and Society
Age Structure
- 0-14 years
- 46.17% (male 4,560,940 /female 4,600,184)
- 15-24 years
- 20.58% (male 2,023,182 /female 2,059,765)
- 25-54 years
- 27.57% (male 2,717,613 /female 2,752,983)
- 55-64 years
- 3% (male 284,187 /female 310,393)
- 65 years and over
- 2.69% (male 234,776 /female 298,537) (2018 est.)
Birth Rate
40.7 births/1,000 population (2018 est.)
Children Under The Age Of 5 Years Underweight
11.7% (2015)
Contraceptive Prevalence Rate
59.2% (2015/16)
Death Rate
7.7 deaths/1,000 population (2018 est.)
Demographic Profile
Malawi has made great improvements in maternal and child health, but has made less progress in reducing its high fertility rate. In both rural and urban areas, very high proportions of mothers are receiving prenatal care and skilled birth assistance, and most children are being vaccinated. Malawi’s fertility rate, however, has only declined slowly, decreasing from more than 7 children per woman in the 1980s to about 5.5 today. Nonetheless, Malawians prefer smaller families than in the past, and women are increasingly using contraceptives to prevent or space pregnancies. Rapid population growth and high population density is putting pressure on Malawi’s land, water, and forest resources. Reduced plot sizes and increasing vulnerability to climate change, further threaten the sustainability of Malawi’s agriculturally based economy and will worsen food shortages. About 80% of the population is employed in agriculture.Historically, Malawians migrated abroad in search of work, primarily to South Africa and present-day Zimbabwe, but international migration became uncommon after the 1970s, and most migration in recent years has been internal. During the colonial period, Malawians regularly migrated to southern Africa as contract farm laborers, miners, and domestic servants. In the decade and a half after independence in 1964, the Malawian Government sought to transform its economy from one dependent on small-scale farms to one based on estate agriculture. The resulting demand for wage labor induced more than 300,000 Malawians to return home between the mid-1960s and the mid-1970s. In recent times, internal migration has generally been local, motivated more by marriage than economic reasons.
Dependency Ratios
- elderly dependency ratio
- 5.7 (2015 est.)
- potential support ratio
- 17.4 (2015 est.)
- total dependency ratio
- 91 (2015 est.)
- youth dependency ratio
- 85.3 (2015 est.)
Drinking Water Source
- improved: urban: 95.7% of population
- rural: 89.1% of population
- total: 90.2% of population
- unimproved: urban: 4.3% of population
- rural: 10.9% of population
- total: 9.8% of population (2015 est.)
Education Expenditures
4.7% of GDP (2016)
Ethnic Groups
Chewa 35.1%, Lomwe 18.9%, Yao 13.1%, Ngoni 12%, Tumbuka 9.4%, Sena 3.5%, Mang'anja 2.5%, Tonga 1.8%, Nyanja 1%, Nkhonde 0.9%, other 1.8% (2015-16 est.)
Health Expenditures
11.4% of GDP (2014)
Hiv Aids Adult Prevalence Rate
9.6% (2017 est.)
Hiv Aids Deaths
17,000 (2017 est.)
Hiv Aids People Living With Hiv Aids
1 million (2017 est.)
Hospital Bed Density
1.3 beds/1,000 population (2011)
Infant Mortality Rate
- female
- 35.5 deaths/1,000 live births (2018 est.)
- male
- 48.6 deaths/1,000 live births (2018 est.)
- total
- 42.1 deaths/1,000 live births (2018 est.)
Languages
English (official), Chichewa (common), Chinyanja, Chiyao, Chitumbuka, Chilomwe, Chinkhonde, Chingoni, Chisena, Chitonga, Chinyakyusa, Chilambya
Life Expectancy At Birth
- female
- 64.3 years (2018 est.)
- male
- 60.2 years (2018 est.)
- total population
- 62.2 years (2018 est.)
Literacy
- definition
- age 15 and over can read and write (2015 est.)
- female
- 55.2% (2015 est.)
- male
- 69.8% (2015 est.)
- total population
- 62.1% (2015 est.)
Major Infectious Diseases
- animal contact diseases
- rabies (2016)
- degree of risk
- very high (2016)
- food or waterborne diseases
- bacterial and protozoal diarrhea, hepatitis A, and typhoid fever (2016)
- vectorborne diseases
- malaria and dengue fever (2016)
- water contact diseases
- schistosomiasis (2016)
Major Urban Areas Population
1.03 million LILONGWE (capital), 879,000 Blantyre-Limbe (2018)
Maternal Mortality Rate
634 deaths/100,000 live births (2015 est.)
Median Age
- female
- 16.8 years (2018 est.)
- male
- 16.5 years
- total
- 16.6 years
Mother S Mean Age At First Birth
- 18.9 years (2015/16 est.)
- note
- median age at first birth among women 25-29
Nationality
- adjective
- Malawian
- noun
- Malawian(s)
Net Migration Rate
0 migrant(s)/1,000 population (2017 est.)
Obesity Adult Prevalence Rate
5.8% (2016)
Physicians Density
0.02 physicians/1,000 population (2009)
Population
- 19,842,560 (July 2018 est.)
- note
- estimates for this country explicitly take into account the effects of excess mortality due to AIDS; this can result in lower life expectancy, higher infant mortality, higher death rates, lower population growth rates, and changes in the distribution of population by age and sex than would otherwise be expected
Population Growth Rate
3.31% (2018 est.)
Religions
Protestant 27.2% (includes Church of Central Africa Presbyterian 17.7%, Seventh Day Adventist/Baptist 6.9%, Anglican 2.6%), Catholic 18.4%, other Christian 41%, Muslim 12.1%, other 0.3%, none 1% (2015-16 est.)
Sanitation Facility Access
- improved: urban: 47.3% of population (2015 est.)
- rural: 39.8% of population (2015 est.)
- total: 41% of population (2015 est.)
- unimproved: urban: 52.7% of population (2015 est.)
- rural: 60.2% of population (2015 est.)
- total: 59% of population (2015 est.)
School Life Expectancy Primary To Tertiary Education
- female
- 11 years (2011)
- male
- 11 years (2011)
- total
- 11 years (2011)
Sex Ratio
- 0-14 years
- 0.99 male(s)/female (2017 est.)
- 15-24 years
- 0.99 male(s)/female (2017 est.)
- 25-54 years
- 0.99 male(s)/female (2017 est.)
- 55-64 years
- 0.91 male(s)/female (2017 est.)
- 65 years and over
- 0.79 male(s)/female (2017 est.)
- at birth
- 1.01 male(s)/female (2017 est.)
- total population
- 0.98 male(s)/female (2017 est.)
Total Fertility Rate
5.43 children born/woman (2018 est.)
Unemployment Youth Ages 15 24
- female
- 8.5% (2013 est.)
- male
- 7.4% (2013 est.)
- total
- 8% (2013 est.)
Urbanization
- rate of urbanization
- 4.19% annual rate of change (2015-20 est.)
- urban population
- 16.9% of total population (2018)
Government
Administrative Divisions
28 districts; Balaka, Blantyre, Chikwawa, Chiradzulu, Chitipa, Dedza, Dowa, Karonga, Kasungu, Likoma, Lilongwe, Machinga, Mangochi, Mchinji, Mulanje, Mwanza, Mzimba, Neno, Ntcheu, Nkhata Bay, Nkhotakota, Nsanje, Ntchisi, Phalombe, Rumphi, Salima, Thyolo, Zomba
Capital
- geographic coordinates
- 13 58 S, 33 47 E
- name
- Lilongwe
- time difference
- UTC+2 (7 hours ahead of Washington, DC, during Standard Time)
Citizenship
- citizenship by birth
- no
- citizenship by descent only
- at least one parent must be a citizen of Malawi
- dual citizenship recognized
- no
- residency requirement for naturalization
- 7 years
Constitution
- amendments
- proposed by the National Assembly; passage of amendments affecting constitutional articles including the sovereignty and territory of the state, fundamental constitutional principles, human rights, voting rights, and the judiciary requires majority approval in a referendum and majority approval by the Assembly; passage of other amendments requires at least two-thirds majority vote of the Assembly; amended several times, last in 2017 (2018)
- history
- previous 1953 (preindependence), 1966; latest drafted January to May 1994, approved 16 May 1994, entered into force 18 May 1995 (2018)
Country Name
- conventional long form
- Republic of Malawi
- conventional short form
- Malawi
- etymology
- named for the East African Maravi Kingdom of the 16th century; the word "maravi" means "fire flames"
- former
- British Central African Protectorate, Nyasaland Protectorate, Nyasaland
- local long form
- Dziko la Malawi
- local short form
- Malawi
Diplomatic Representation From The Us
- chief of mission
- Ambassador Virginia E. PALMER (since 5 February 2015)
- embassy
- 16 Jomo Kenyatta Road, Lilongwe 3
- FAX
- 265 (0) 1770471
- mailing address
- P.O. Box 30016, Lilongwe 3, Malawi
- telephone
- 265 (0) 1773166
Diplomatic Representation In The Us
- chancery
- 2408 Massachusetts Avenue NW, Washington, DC 20008
- chief of mission
- Ambassador Edward Yakobe SAWERENGERA (since 16 September 2016)
- FAX
- [1] (202) 721-0288
- telephone
- [1] (202) 721-0270
Executive Branch
- cabinet
- Cabinet named by the president
- chief of state
- President Arthur Peter MUTHARIKA (since 31 May 2014); Vice President Saulos CHILIMA (since 31 May 2014); note - the president is both chief of state and head of government
- election results
- Peter MUTHARIKA elected president; percent of vote - Peter MUTHARIKA (DPP) 36.4%, Lazarus CHAKWERA (MCP) 27.8%, Joyce BANDA (PP) 20.2%, Atupele MULUZI (UDF) 13.7%, other 1.9%
- elections/appointments
- president directly elected by simple majority popular vote for a 5-year term (eligible for a second term); election last held on 20 May 2014 (next to be held on 21 May 2019)
- head of government
- President Arthur Peter MUTHARIKA (since 31 May 2014); Vice President Saulos CHILIMA (since 31 May 2014)
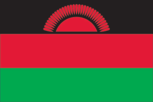
Flag Description
three equal horizontal bands of black (top), red, and green with a radiant, rising, red sun centered on the black band; black represents the native peoples, red the blood shed in their struggle for freedom, and green the color of nature; the rising sun represents the hope of freedom for the continent of Africa
Government Type
presidential republic
Independence
6 July 1964 (from the UK)
International Law Organization Participation
accepts compulsory ICJ jurisdiction with reservations; accepts ICCt jurisdiction
International Organization Participation
ACP, AfDB, AU, C, CD, COMESA, FAO, G-77, IAEA, IBRD, ICAO, ICCt, ICRM, IDA, IFAD, IFC, IFRCS, ILO, IMF, IMO, Interpol, IOC, IOM, IPU, ISO (correspondent), ITSO, ITU, ITUC (NGOs), MIGA, MINURSO, MONUSCO, NAM, OPCW, SADC, UN, UNCTAD, UNESCO, UNIDO, UNISFA, UNOCI, UNWTO, UPU, WCO, WFTU (NGOs), WHO, WIPO, WMO, WTO
Judicial Branch
- highest courts
- Supreme Court of Appeal (consists of the chief justice and at least 3 judges)
- judge selection and term of office
- Supreme Court chief justice appointed by the president and confirmed by the National Assembly; other judges appointed by the president upon the recommendation of the Judicial Service Commission, which regulates judicial officers; judges serve until age 65
- subordinate courts
- High Court; magistrate courts; Industrial Relations Court; district and city traditional or local courts
Legal System
mixed legal system of English common law and customary law; judicial review of legislative acts in the Supreme Court of Appeal
Legislative Branch
- description
- unicameral National Assembly (193 seats; members directly elected in single-seat constituencies by simple majority vote to serve 5-year terms)
- election results
- percent of vote by party - DPP 22%, MCP 17.4%, PP 18.5%, UDF 9.6%, other 2.8%, independent 29.7%; seats by party - DPP 51, MCP 48, PP 26, UDF 14, other 2, independent 52
- elections
- last held on 20-22 May 2014 (next to be held on 21 May 2019)
National Anthem
- lyrics/music
- Michael-Fredrick Paul SAUKA
- name
- "Mulungu dalitsa Malawi" (Oh God Bless Our Land of Malawi)
- note
- adopted 1964
National Holiday
Independence Day, 6 July (1964); note - also called Republic Day since 6 July 1966
National Symbol S
lion; national colors: black, red, green
Political Parties And Leaders
Alliance for Democracy or AFORD [Enoch CHIHANA]Democratic Progressive Party or DPP [Peter MUTHARIKA]Malawi Congress Party or MCP [Lazarus CHAKWERA]People's Party or PP [Joyce BANDA]United Democratic Front or UDF [Atupele MULUZI]
Suffrage
18 years of age; universal
Economy
Agriculture Products
tobacco, sugarcane, tea, corn, potatoes, sweet potatoes, cassava (manioc, tapioca), sorghum, pulses, cotton, groundnuts, macadamia nuts, coffee; cattle, goats
Budget
- expenditures
- 1.567 billion (2017 est.)
- revenues
- 1.356 billion (2017 est.)
Budget Surplus Or Deficit
-3.4% (of GDP) (2017 est.)
Central Bank Discount Rate
- 16% (31 December 2017 est.)
- 24% (31 December 2016 est.)
Commercial Bank Prime Lending Rate
- 38.1% (31 December 2017 est.)
- 44.11% (31 December 2016 est.)
Current Account Balance
- -$591 million (2017 est.)
- -$744 million (2016 est.)
Debt External
- $2.102 billion (31 December 2017 est.)
- $1.5 billion (31 December 2016 est.)
Distribution Of Family Income Gini Index
- 46.1 (2010)
- 39 (2004)
Economy Overview
Landlocked Malawi ranks among the world's least developed countries. The country’s economic performance has historically been constrained by policy inconsistency, macroeconomic instability, poor infrastructure, rampant corruption, high population growth, and poor health and education outcomes that limit labor productivity. The economy is predominately agricultural with about 80% of the population living in rural areas. Agriculture accounts for about one-third of GDP and 80% of export revenues. The performance of the tobacco sector is key to short-term growth as tobacco accounts for more than half of exports, although Malawi is looking to diversify away from tobacco to other cash crops.The economy depends on substantial inflows of economic assistance from the IMF, the World Bank, and individual donor nations. Donors halted direct budget support from 2013 to 2016 because of concerns about corruption and fiscal carelessness, but the World Bank resumed budget support in May 2017. In 2006, Malawi was approved for relief under the Heavily Indebted Poor Countries (HIPC) program but recent increases in domestic borrowing mean that debt servicing in 2016 exceeded the levels prior to HIPC debt relief.Heavily dependent on rain-fed agriculture, with corn being the staple crop, Malawi’s economy was hit hard by the El Nino-driven drought in 2015 and 2016, and now faces threat from the fall armyworm. The drought also slowed economic activity, led to two consecutive years of declining economic growth, and contributed to high inflation rates. Depressed food prices over 2017 led to a significant drop in inflation (from an average of 21.7% in 2016 to 12.3% in 2017), with a similar drop in interest rates.
Exchange Rates
- Malawian kwachas (MWK) per US dollar -
- 731.69 (2017 est.)
- 720.1 (2016 est.)
- 713.85 (2015 est.)
- 499.6 (2014 est.)
- 424.9 (2013 est.)
Exports
- $1.42 billion (2017 est.)
- $1.361 billion (2016 est.)
Exports Commodities
tobacco (55%), dried legumes (8.8%), sugar (6.7%), tea (5.7%), cotton (2%), peanuts, coffee, soy (2015 est.)
Exports Partners
Zimbabwe 13.1%, Mozambique 11.8%, Belgium 10.7%, South Africa 6.3%, Netherlands 5%, UK 4.7%, Germany 4.3%, US 4.2% (2017)
Fiscal Year
1 July - 30 June
Gdp Composition By End Use
- exports of goods and services
- 27.9% (2017 est.)
- government consumption
- 16.3% (2017 est.)
- household consumption
- 84.3% (2017 est.)
- imports of goods and services
- -43.8% (2017 est.)
- investment in fixed capital
- 15.3% (2017 est.)
- investment in inventories
- 0% (2017 est.)
Gdp Composition By Sector Of Origin
- agriculture
- 28.6% (2017 est.)
- industry
- 15.4% (2017 est.)
- services
- 56% (2017 est.)
Gdp Official Exchange Rate
$6.24 billion (2017 est.) (2017 est.)
Gdp Per Capita Ppp
- $1,200 (2017 est.)
- $1,200 (2016 est.)
- $1,200 (2015 est.)
- note
- data are in 2017 dollars
Gdp Purchasing Power Parity
- $22.42 billion (2017 est.)
- $21.56 billion (2016 est.)
- $21.08 billion (2015 est.)
- note
- data are in 2017 dollars
Gdp Real Growth Rate
- 4% (2017 est.)
- 2.3% (2016 est.)
- 3% (2015 est.)
Gross National Saving
- 3.9% of GDP (2017 est.)
- -2.8% of GDP (2016 est.)
- 2.8% of GDP (2015 est.)
Household Income Or Consumption By Percentage Share
- highest 10%
- 37.5% (2010)
- lowest 10%
- 37.5% (2010 est.)
Imports
- $2.312 billion (2017 est.)
- $2.277 billion (2016 est.)
Imports Commodities
food, petroleum products, semi-manufactures, consumer goods, transportation equipment
Imports Partners
South Africa 20.7%, China 14.2%, India 11.6%, UAE 7%, Netherlands 4.4% (2017)
Industrial Production Growth Rate
1.2% (2017 est.)
Industries
tobacco, tea, sugar, sawmill products, cement, consumer goods
Inflation Rate Consumer Prices
- 12.2% (2017 est.)
- 21.7% (2016 est.)
Labor Force
7 million (2013 est.)
Labor Force By Occupation
- agriculture
- 76.9%
- industry
- 4.1%
- services
- 19% (2013 est.)
Market Value Of Publicly Traded Shares
- $18.97 million (31 December 2017 est.)
- $8.643 million (31 December 2016 est.)
- $101.9 million (31 December 2015 est.)
Population Below Poverty Line
50.7% (2010 est.)
Public Debt
- 59.2% of GDP (2017 est.)
- 60.3% of GDP (2016 est.)
Reserves Of Foreign Exchange And Gold
- $780.2 million (31 December 2017 est.)
- $585.7 million (31 December 2016 est.)
Stock Of Broad Money
- $632.4 million (31 December 2017 est.)
- $534 million (31 December 2016 est.)
Stock Of Direct Foreign Investment Abroad
- note
- NA
Stock Of Direct Foreign Investment At Home
$142.5 million (2015 est.)
Stock Of Domestic Credit
- $1.161 billion (31 December 2017 est.)
- $1.049 billion (31 December 2016 est.)
Stock Of Narrow Money
- $632.4 million (31 December 2017 est.)
- $534 million (31 December 2016 est.)
Taxes And Other Revenues
21.7% (of GDP) (2017 est.)
Unemployment Rate
20.4% (2013 est.)
Energy
Carbon Dioxide Emissions From Consumption Of Energy
1.082 million Mt (2017 est.)
Crude Oil Exports
0 bbl/day (2015 est.)
Crude Oil Imports
0 bbl/day (2015 est.)
Crude Oil Production
0 bbl/day (2017 est.)
Crude Oil Proved Reserves
0 bbl (1 January 2018 est.)
Electricity Access
- electrification - rural areas
- 4% (2013)
- electrification - total population
- 9% (2013)
- electrification - urban areas
- 32% (2013)
- population without electricity
- 14.9 million (2013)
Electricity Consumption
1.321 billion kWh (2016 est.)
Electricity Exports
0 kWh (2016 est.)
Electricity From Fossil Fuels
1% of total installed capacity (2016 est.)
Electricity From Hydroelectric Plants
93% of total installed capacity (2017 est.)
Electricity From Nuclear Fuels
0% of total installed capacity (2017 est.)
Electricity From Other Renewable Sources
6% of total installed capacity (2017 est.)
Electricity Imports
0 kWh (2016 est.)
Electricity Installed Generating Capacity
375,000 kW (2016 est.)
Electricity Production
1.42 billion kWh (2016 est.)
Natural Gas Consumption
0 cu m (2017 est.)
Natural Gas Exports
0 cu m (2017 est.)
Natural Gas Imports
0 cu m (2017 est.)
Natural Gas Production
0 cu m (2017 est.)
Natural Gas Proved Reserves
0 cu m (2017 est.)
Refined Petroleum Products Consumption
6,000 bbl/day (2016 est.)
Refined Petroleum Products Exports
0 bbl/day (2015 est.)
Refined Petroleum Products Imports
4,769 bbl/day (2015 est.)
Refined Petroleum Products Production
0 bbl/day (2015 est.)
Communications
Broadband Fixed Subscriptions
- subscriptions per 100 inhabitants
- less than 1 (2017 est.)
- total
- 9,220 (2017 est.)
Broadcast Media
radio is the main broadcast medium; privately owned Zodiak radio has the widest national broadcasting reach, followed by state-run radio; numerous private and community radio stations broadcast in cities and towns around the country; the largest TV network is government-owned, but at least 4 private TV networks broadcast in urban areas; relays of multiple international broadcasters are available (2017)
Internet Country Code
.mw
Internet Users
- percent of population
- 9.6% (July 2016 est.)
- total
- 1,785,369 (July 2016 est.)
Telephone System
- domestic
- limited fixed-line subscribership less than 1 per 100 households; mobile-cellular services are expanding but network coverage is limited and is based around the main urban areas; mobile-cellular subscribership approaching 40 per 100 households (2017)
- general assessment
- rudimentary; two fixed-line and two mobile-cellular operators govern the market; some mobile services to rural areas; in a resolution to discourage crime the regulatory has imposed SIM card registration since July 2018; 50 licensed ISPs; DSL services are available; LTE services; trial to increase broadband availability (2017)
- international
- country code - 265; satellite earth stations - 2 Intelsat (1 Indian Ocean, 1 Atlantic Ocean); recent access to international submarine fibre cable via neighboring countries (2017)
Telephones Fixed Lines
- subscriptions per 100 inhabitants
- less than 1 (2017 est.)
- total subscriptions
- 17,337 (2017 est.)
Telephones Mobile Cellular
- subscriptions per 100 inhabitants
- 40 (2017 est.)
- total subscriptions
- 7,772,503 (2017 est.)
Transportation
Airports
32 (2013)
Airports With Paved Runways
- 1,524 to 2,437 m
- 2 (2017)
- 914 to 1,523 m
- 4 (2017)
- over 3,047 m
- 1 (2017)
- total
- 7 (2017)
Airports With Unpaved Runways
- 1,524 to 2,437 m
- 1 (2013)
- 914 to 1,523 m
- 11 (2013)
- total
- 25 (2013)
- under 914 m
- 13 (2013)
Civil Aircraft Registration Country Code Prefix
7Q (2016)
National Air Transport System
- annual freight traffic on registered air carriers
- 5,467 mt-km (2015)
- annual passenger traffic on registered air carriers
- 6,010 (2015)
- inventory of registered aircraft operated by air carriers
- 2 (2015)
- number of registered air carriers
- 1 (2015)
Ports And Terminals
- lake port(s)
- Chipoka, Monkey Bay, Nkhata Bay, Nkhotakota, Chilumba (Lake Nyasa)
Railways
- narrow gauge
- 767 km 1.067-m gauge (2014)
- total
- 767 km (2014)
Roadways
- paved
- 4,074 km (2015)
- total
- 15,452 km (2015)
- unpaved
- 11,378 km (2015)
Waterways
700 km (on Lake Nyasa [Lake Malawi] and Shire River) (2010)
Military and Security
Military Branches
Malawi Defense Force (MDF): Army (includes Air Wing, Marine Unit) (2018)
Military Expenditures
- 0.61% of GDP (2016)
- 0.7% of GDP (2015)
- 0.89% of GDP (2014)
- 1.24% of GDP (2013)
- 0.82% of GDP (2012)
Military Service Age And Obligation
18 years of age for voluntary military service; high school equivalent required for enlisted recruits and college equivalent for officer recruits; initial engagement is 7 years for enlisted personnel and 10 years for officers (2014)
Transnational Issues
Disputes International
dispute with Tanzania over the boundary in Lake Nyasa (Lake Malawi) and the meandering Songwe River; Malawi contends that the entire lake up to the Tanzanian shoreline is its territory, while Tanzania claims the border is in the center of the lake; the conflict was reignited in 2012 when Malawi awarded a license to a British company for oil exploration in the lake
Refugees And Internally Displaced Persons
- IDPs
- 8,463 (floods in 2015) (2016)
- refugees (country of origin)
- 22,696 (Democratic Republic of the Congo) (refugees and asylum seekers), 7,500 (Burundi) (refugees and asylum seekers) (2018)