2015 Edition
CIA World Factbook 2015 Archive (Wayback Machine ZIP)
Introduction
Background
Settled by Norwegian and Celtic (Scottish and Irish) immigrants during the late 9th and 10th centuries A.D., Iceland boasts the world's oldest functioning legislative assembly, the Althing, established in 930. Independent for over 300 years, Iceland was subsequently ruled by Norway and Denmark. Fallout from the Askja volcano of 1875 devastated the Icelandic economy and caused widespread famine. Over the next quarter century, 20% of the island's population emigrated, mostly to Canada and the US. Denmark granted limited home rule in 1874 and complete independence in 1944. The second half of the 20th century saw substantial economic growth driven primarily by the fishing industry. The economy diversified greatly after the country joined the European Economic Area in 1994, but Iceland was especially hard hit by the global financial crisis in the years following 2008. Literacy, longevity, and social cohesion are first rate by world standards.
Geography
Area
- land
- 100,250 sq km
- total
- 103,000 sq km
- water
- 2,750 sq km
Area - comparative
slightly smaller than Pennsylvania; about the same size as Kentucky
Climate
temperate; moderated by North Atlantic Current; mild, windy winters; damp, cool summers
Coastline
4,970 km
Elevation extremes
- highest point
- Hvannadalshnukur 2,110 m (at Vatnajokull Glacier)
- lowest point
- Atlantic Ocean 0 m
Environment - current issues
water pollution from fertilizer runoff; inadequate wastewater treatment
Environment - international agreements
- party to
- Air Pollution, Air Pollution-Persistent Organic Pollutants, Biodiversity, Climate Change, Climate Change-Kyoto Protocol, Desertification, Endangered Species, Hazardous Wastes, Kyoto Protocol, Law of the Sea, Marine Dumping, Ozone Layer Protection, Ship Pollution, Transboundary Air Pollution, Wetlands, Whaling
- signed, but not ratified
- Environmental Modification, Marine Life Conservation
Freshwater withdrawal (domestic/industrial/agricultural)
- per capita
- 539.2 cu m/yr (2005)
- total
- 0.17 cu km/yr (49%/8%/42%)
Geographic coordinates
65 00 N, 18 00 W
Geography - note
strategic location between Greenland and Europe; westernmost European country; Reykjavik is the northernmost national capital in the world; more land covered by glaciers than in all of continental Europe
Irrigated land
NA
Land boundaries
0 km
Land use
- arable land 1.2%; permanent crops 0%; permanent pasture 17.5%
- agricultural land
- 18.7%
- forest
- 0.3%
- other
- 81% (2011 est.)
Location
Northern Europe, island between the Greenland Sea and the North Atlantic Ocean, northwest of the United Kingdom
Map references
Arctic Region
Maritime claims
- continental shelf
- 200 nm or to the edge of the continental margin
- exclusive economic zone
- 200 nm
- territorial sea
- 12 nm
Natural hazards
- earthquakes and volcanic activity
- volcanism
- Iceland, situated on top of a hotspot, experiences severe volcanic activity; Eyjafjallajokull (elev. 1,666 m) erupted in 2010, sending ash high into the atmosphere and seriously disrupting European air traffic; scientists continue to monitor nearby Katla (elev. 1,512 m), which has a high probability of eruption in the very near future, potentially disrupting air traffic; Grimsvoetn and Hekla are Iceland's most active volcanoes; other historically active volcanoes include Askja, Bardarbunga, Brennisteinsfjoll, Esjufjoll, Hengill, Krafla, Krisuvik, Kverkfjoll, Oraefajokull, Reykjanes, Torfajokull, and Vestmannaeyjar
Natural resources
fish, hydropower, geothermal power, diatomite
Terrain
mostly plateau interspersed with mountain peaks, icefields; coast deeply indented by bays and fiords
Total renewable water resources
170 cu km (2011)
People and Society
Age structure
- 0-14 years
- 20.43% (male 34,653/female 33,161)
- 15-24 years
- 14.03% (male 23,661/female 22,914)
- 25-54 years
- 40.09% (male 67,183/female 65,871)
- 55-64 years
- 11.67% (male 19,502/female 19,230)
- 65 years and over
- 13.78% (male 21,344/female 24,399) (2015 est.)
Birth rate
13.91 births/1,000 population (2015 est.)
Death rate
6.28 deaths/1,000 population (2015 est.)
Dependency ratios
- elderly dependency ratio
- 20.8%
- potential support ratio
- 4.8% (2015 est.)
- total dependency ratio
- 51.6%
- youth dependency ratio
- 30.8%
Drinking water source
- urban: 100% of population
- rural: 100% of population
- total: 100% of population
- urban: 0% of population
- rural: 0% of population
- total: 0% of population (2015 est.)
Education expenditures
7.4% of GDP (2011)
Ethnic groups
homogeneous mixture of descendants of Norse and Celts 94%, population of foreign origin 6%
Health expenditures
9.1% of GDP (2013)
HIV/AIDS - adult prevalence rate
NA
HIV/AIDS - deaths
NA
HIV/AIDS - people living with HIV/AIDS
NA
Hospital bed density
3.2 beds/1,000 population (2012)
Infant mortality rate
- female
- 1.91 deaths/1,000 live births (2015 est.)
- male
- 2.2 deaths/1,000 live births
- total
- 2.06 deaths/1,000 live births
Languages
Icelandic, English, Nordic languages, German widely spoken
Life expectancy at birth
- female
- 85.22 years (2015 est.)
- male
- 80.81 years
- total population
- 82.97 years
Major urban areas - population
REYKJAVIK (capital) 184,000 (2014)
Median age
- female
- 36.9 years (2014 est.)
- male
- 35.9 years
- total
- 36.4 years
Nationality
- adjective
- Icelandic
- noun
- Icelander(s)
Net migration rate
4.43 migrant(s)/1,000 population (2015 est.)
Obesity - adult prevalence rate
23.9% (2014)
Physicians density
3.48 physicians/1,000 population (2012)
Population
331,918 (July 2015 est.)
Population growth rate
1.21% (2015 est.)
Religions
Evangelical Lutheran Church of Iceland (official) 73.8%, Roman Catholic 3.6%, Reykjavik Free Church 2.9%, Hafnarfjorour Free Church 2%, The Independent Congregation 1%, other religions 3.9% (includes Pentecostal and Asatru Association), none 5.6%, other or unspecified 7.2% (2015 est.)
Sanitation facility access
- urban: 98.7% of population
- rural: 100% of population
- total: 100% of population
- urban: 0% of population
- rural: 0% of population
- total: 1.2% of population (2015 est.)
School life expectancy (primary to tertiary education)
- female
- 20 years (2012)
- male
- 18 years
- total
- 19 years
Sex ratio
- 0-14 years
- 1.04 male(s)/female
- 15-24 years
- 1.03 male(s)/female
- 25-54 years
- 1.02 male(s)/female
- 55-64 years
- 1.01 male(s)/female
- 65 years and over
- 0.87 male(s)/female
- at birth
- 1.05 male(s)/female
- total population
- 1.01 male(s)/female (2015 est.)
Total fertility rate
2.02 children born/woman (2015 est.)
Unemployment, youth ages 15-24
- female
- 12.4% (2012 est.)
- male
- 14.7%
- total
- 13.6%
Urbanization
- rate of urbanization
- 1.25% annual rate of change (2010-15 est.)
- urban population
- 94.1% of total population (2015)
Government
Administrative divisions
8 regions; Austurland, Hofudhborgarsvaedhi, Nordhurland Eystra, Nordhurland Vestra, Sudhurland, Sudhurnes, Vestfirdhir, Vesturland
Capital
- geographic coordinates
- 64 09 N, 21 57 W
- name
- Reykjavik
- time difference
- UTC 0 (5 hours ahead of Washington, DC, during Standard Time)
Constitution
several previous; latest ratified 16 June 1944, effective 17 June 1944 (at independence); amended many times, last in 2013; note - a new constitution drafted in 2012 in the aftermath of the country's banking collapse was voted down in April 2013 by the recently elected parliament, though several amendments were passed (2013)
Country name
- conventional long form
- Republic of Iceland
- conventional short form
- Iceland
- local long form
- Lydveldid Island
- local short form
- Island
Diplomatic representation from the US
- chief of mission
- Ambassador Robert C. BARBER (since 8 January 2015)
- embassy
- Laufasvegur 21, 101 Reykjavik
- FAX
- [354] 562-9118
- mailing address
- US Department of State, 5640 Reykjavik Place, Washington, D.C. 20521-5640
- telephone
- [354] 595-22 00
Diplomatic representation in the US
- chancery
- House of Sweden, 2900 K Street NW
- chief of mission
- Ambassador Geir Hilmar HAARDE (since 23 February 2015)
- consulate(s) general
- New York
- FAX
- [1] (202) 265-6656
- telephone
- [1] (202) 265-6653
Executive branch
- cabinet
- Cabinet appointed by the prime minister
- chief of state
- President Olafur Ragnar GRIMSSON (since 1 August 1996)
- election results
- Olafur Ragnar GRIMSSON elected president; percent of vote - Olafur Ragnar GRIMSSON (independent) 52.8%, Thora ARNORSDOTTIR (independent) 33.2%, Ari Trausti GUDMUNDSSON (independent) 8.6%, other 5.4%
- elections/appointments
- president directly elected by simple majority popular vote for a 4-year term (no term limits); election last held on 30 June 2012 (next to be held in June 2016); following legislative elections, the leader of the majority party or majority coalition becomes prime minister
- head of government
- Prime Minister Sigmundur David GUNNLAUGSSON (since 23 May 2013)
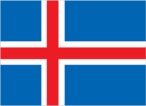
Flag description
blue with a red cross outlined in white extending to the edges of the flag; the vertical part of the cross is shifted to the hoist side in the style of the Dannebrog (Danish flag); the colors represent three of the elements that make up the island: red is for the island's volcanic fires, white recalls the snow and ice fields of the island, and blue is for the surrounding ocean
Government type
constitutional republic
Independence
1 December 1918 (became a sovereign state under the Danish Crown); 17 June 1944 (from Denmark; birthday of Jon SIGURDSSON leader of Iceland's 19th Century independence movement)
International law organization participation
has not submitted an ICJ jurisdiction declaration; accepts ICCt jurisdiction
International organization participation
Arctic Council, Australia Group, BIS, CBSS, CD, CE, EAPC, EBRD, EFTA, EU (candidate country), FAO, FATF, IAEA, IBRD, ICAO, ICC (national committees), ICCt, ICRM, IDA, IFAD, IFC, IFRCS, IHO, ILO, IMF, IMO, IMSO, Interpol, IOC, IOM, IPU, ISO, ITSO, ITU, ITUC (NGOs), MIGA, NATO, NC, NEA, NIB, NSG, OAS (observer), OECD, OPCW, OSCE, PCA, Schengen Convention, UN, UNCTAD, UNESCO, UPU, WCO, WHO, WIPO, WMO, WTO
Judicial branch
- highest court(s)
- Supreme Court or Haestirettur (consists of 9 judges)
- judge selection and term of office
- judges proposed by Ministry of Interior selection committee and appointed by the president; judges appointed for an indefinite period
- subordinate courts
- 8 district courts; Labor Court
Legal system
civil law system influenced by the Danish model
Legislative branch
- description
- unicameral Althingi (parliament) (63 seats; members directly elected in multi-seat constituencies by proportional representation vote to serve 4-year terms)
- election results
- percent of vote by party - SDA 30.16%, IP 25.4%, LGM 17.46%, PP 14.29%, BF 3.18%, Dawn 3.18%, Rainbow 3.18%, Pirate Party 1.59%, Solidarity 1.59%; seats by party - SDA 19, IP 16, LGM 11, PP 9, BF 2, Dawn 2, Rainbow 2, Pirate Party 1, Solidarity 1
- elections
- last held on 27 April 2013 (next to be held in 2017)
National anthem
- lyrics/music
- Matthias JOCHUMSSON/Sveinbjorn SVEINBJORNSSON
- name
- "Lofsongur" (Song of Praise)
- note
- adopted 1944; also known as "O, Gud vors lands" (O, God of Our Land), the anthem was originally written and performed in 1874
National holiday
Independence Day, 17 June (1944)
National symbol(s)
gyrfalcon; national colors: blue, white, red
Political parties and leaders
- Bright Future (Bjort Framtid) or BF [Gudmundur STEINGRIMSSON]
- Dawn (Dogun) [Benedikt SIGURDARSON]
- Independence Party (Sjalfstaedisflokkurinn) or IP [Bjarni BENEDIKTSSON]
- Left-Green Movement (Vinstrihreyfingin) or LGM [Katrin JAKOBSDOTTIR]
- Pirate Party [Birgitta JONSDOTTIR]
- Progressive Party (Framsoknarflokkurinn) or PP [Sigmundur David GUNNLAUGSSON]
- Rainbow [Bjarni HAROARSON]; note - party was created to last for the 2013 election only
- Social Democratic Alliance (Samfylkingin) or SDA [Arni Pall ARNASON]
- Solidarity (Samstada) [Lilja MOSESDOTTIR]
Suffrage
18 years of age; universal
Economy
Agriculture - products
potatoes, green vegetables; mutton, chicken, pork, beef, dairy products; fish
Budget
- expenditures
- $7.315 billion (2014 est.)
- revenues
- $7.332 billion
Budget surplus (+) or deficit (-)
0.1% of GDP (2014 est.)
Central bank discount rate
- 5.4% (31 January 2012)
- 5.75% (31 December 2010)
Commercial bank prime lending rate
- 8.2% (31 December 2014 est.)
- 8.17% (31 December 2013 est.)
Current account balance
- $789 million (2014 est.)
- $574 million (2013 est.)
Debt - external
- $102 billion (31 December 2012 est.)
- $110.8 billion (31 December 2011 est.)
Distribution of family income - Gini index
- 28 (2006)
- 25 (2005)
Economy - overview
Iceland's Scandinavian-type social-market economy combines a capitalist structure and free-market principles with an extensive welfare system. Prior to the 2008 crisis, Iceland had achieved high growth, low unemployment, and a remarkably even distribution of income. The economy depends heavily on the fishing industry, which provides 40% of export earnings, more than 12% of GDP, and employs nearly 5% of the work force. It remains sensitive to declining fish stocks as well as to fluctuations in world prices for its main exports: fish and fish products, aluminum, and ferrosilicon. Iceland's economy has been diversifying into manufacturing and service industries in the last decade, particularly within the fields of software production, biotechnology, and tourism. In fall 2013, the Icelandic government approved a joint application by Icelandic, Chinese and Norwegian energy firms to conduct oil exploration off Iceland’s northeast coast. Abundant geothermal and hydropower sources have attracted substantial foreign investment in the aluminum sector, boosted economic growth, and sparked some interest from high-tech firms looking to establish data centers using cheap green energy, although the financial crisis has put several investment projects on hold. Much of Iceland's economic growth in recent years came as the result of a boom in domestic demand, following the rapid expansion of the country's financial sector. Domestic banks expanded aggressively in foreign markets, and consumers and businesses borrowed heavily in foreign currencies, following the privatization of the banking sector in the early 2000s. Worsening global financial conditions throughout 2008 resulted in a sharp depreciation of the krona vis-a-vis other major currencies. The foreign exposure of Icelandic banks, whose loans and other assets totaled more than 10 times the country's GDP, became unsustainable. Iceland's three largest banks collapsed in late 2008. The country secured over $10 billion in loans from the IMF and other countries to stabilize its currency and financial sector, and to back government guarantees for foreign deposits in Icelandic banks. GDP fell 6.8% in 2009, and unemployment peaked at 9.4% in February 2009. Since the collapse of Iceland's financial sector, government economic priorities have included: stabilizing the krona, implementing capital controls, reducing Iceland's high budget deficit, containing inflation, addressing high household debt, restructuring the financial sector, and diversifying the economy. Three new banks were established to take over the domestic assets of the collapsed banks. Two of them have foreign majority ownership, while the State holds a majority of the shares of the third. Iceland began making payments to the UK, the Netherlands, and other claimants in late 2011 following Iceland's Supreme Court ruling that upheld 2008 emergency legislation that gives priority to depositors for compensation from failed Icelandic banks. British and Dutch authorities claim Iceland owes approximately $6.5 billion for compensating British and Dutch citizens who lost deposits in Icesave savings accounts when parent bank Landsbanki failed in 2008. Iceland’s financial woes prompted an initial increase in public support to join the EU and the Eurozone, with accession negotiations beginning in July 2010. However, the election of a new center-right government and declining public support amidst the ongoing Eurozone crisis led to the suspension of negotiations in mid-2013.
Exchange rates
- Icelandic kronur (ISK) per US dollar -
- 116.1 (2014 est.)
- 122.18 (2013 est.)
- 125.08 (2012 est.)
- 115.95 (2011 est.)
- 122.24 (2010 est.)
Exports
- $5 billion (2014 est.)
- $4.996 billion (2013 est.)
Exports - commodities
fish and fish products 40%, aluminum, animal products, ferrosilicon, diatomite (2010 est.)
Exports - partners
Netherlands 30%, Germany 12.1%, UK 9.5%, Norway 4.8%, US 4.7%, France 4.7% (2013)
Fiscal year
calendar year
GDP - composition, by end use
- (2014 est.)
- exports of goods and services
- 54.9%
- government consumption
- 24.6%
- household consumption
- 52.6%
- imports of goods and services
- -47%
- investment in fixed capital
- 13.9%
- investment in inventories
- 1%
GDP - composition, by sector of origin
- agriculture
- 6%
- industry
- 22.4%
- services
- 71.7% (2014 est.)
GDP - per capita (PPP)
- $43,600 (2014 est.)
- $42,900 (2013 est.)
- $41,500 (2012 est.)
- note
- data are in 2014 US dollars
GDP - real growth rate
- 1.8% (2014 est.)
- 3.5% (2013 est.)
- 1.1% (2012 est.)
GDP (official exchange rate)
$16.69 billion (2014 est.)
GDP (purchasing power parity)
- $14.21 billion (2014 est.)
- $13.97 billion (2013 est.)
- $13.5 billion (2012 est.)
- note
- data are in 2014 US dollars
Gross national saving
- 20.7% of GDP (2014 est.)
- 20.2% of GDP (2013 est.)
- 11.8% of GDP (2012 est.)
Household income or consumption by percentage share
- highest 10%
- NA%
- lowest 10%
- NA%
Imports
- $4.675 billion (2014 est.)
- $4.433 billion (2013 est.)
Imports - commodities
machinery and equipment, petroleum products, foodstuffs, textiles
Imports - partners
Norway 15.6%, US 10%, Germany 8.4%, China 8.2%, Brazil 7.7%, Denmark 6.3%, Netherlands 5.2%, UK 4.7%, Sweden 4.2% (2013)
Industrial production growth rate
1% (2014 est.)
Industries
fish processing; aluminum smelting, ferrosilicon production; geothermal power, hydropower, tourism
Inflation rate (consumer prices)
- 2% (2014 est.)
- 3.9% (2013 est.)
Labor force
185,900 (2014 est.)
Labor force - by occupation
- agriculture
- 4.8%
- industry
- 22.2%
- services
- 73% (2008)
Market value of publicly traded shares
- $2.825 billion (31 December 2012 est.)
- $2.021 billion (31 December 2011)
- $1.996 billion (31 December 2010 est.)
Population below poverty line
- NA%
- note
- 332,100 families (2011 est.)
Public debt
- 94% of GDP (2014 est.)
- 97.9% of GDP (2013 est.)
Reserves of foreign exchange and gold
- $5.692 billion (31 December 2014 est.)
- $4.237 billion (31 December 2013 est.)
Stock of broad money
- $8.368 billion (31 December 2013 est.)
- $8.12 billion (31 December 2013 est.)
Stock of direct foreign investment - abroad
- $NA (31 December 2011)
- $8.8 billion (31 December 2008)
Stock of direct foreign investment - at home
- $NA
- $9.2 billion (31 December 2008 est.)
Stock of domestic credit
- $21.86 billion (31 December 2014 est.)
- $21.22 billion (31 December 2013 est.)
Stock of narrow money
- $4.31 billion (31 December 2014 est.)
- $4.215 billion (31 December 2013 est.)
Taxes and other revenues
45.3% of GDP (2014 est.)
Unemployment rate
- 5% (2014 est.)
- 5.4% (2013 est.)
Energy
Carbon dioxide emissions from consumption of energy
3.505 million Mt (2012 est.)
Crude oil - exports
0 bbl/day (2012 est.)
Crude oil - imports
0 bbl/day (2010 est.)
Crude oil - production
0 bbl/day (2013 est.)
Crude oil - proved reserves
0 bbl (1 January 2014 est.)
Electricity - consumption
16.58 billion kWh (2011 est.)
Electricity - exports
0 kWh (2013 est.)
Electricity - from fossil fuels
4.5% of total installed capacity (2011 est.)
Electricity - from hydroelectric plants
70.6% of total installed capacity (2011 est.)
Electricity - from nuclear fuels
0% of total installed capacity (2011 est.)
Electricity - from other renewable sources
24.9% of total installed capacity (2011 est.)
Electricity - imports
0 kWh (2013 est.)
Electricity - installed generating capacity
2.669 million kW (2011 est.)
Electricity - production
17.19 billion kWh (2012 est.)
Natural gas - consumption
0 cu m (2012 est.)
Natural gas - exports
0 cu m (2013 est.)
Natural gas - imports
0 cu m (2013 est.)
Natural gas - production
0 cu m (2012 est.)
Natural gas - proved reserves
0 cu m (1 January 2014 est.)
Refined petroleum products - consumption
17,160 bbl/day (2013 est.)
Refined petroleum products - exports
1,420 bbl/day (2012 est.)
Refined petroleum products - imports
14,520 bbl/day (2010 est.)
Refined petroleum products - production
0 bbl/day (2012 est.)
Communications
Broadcast media
state-owned public TV broadcaster operates 1 TV channel nationally; several privately owned TV stations broadcast nationally and roughly another half-dozen operate locally; about one-half the households utilize multi-channel cable or satellite TV services; state-owned public radio broadcaster operates 2 national networks and 4 regional stations; 2 privately owned radio stations operate nationally and another 15 provide more limited coverage (2007)
Internet country code
.is
Internet users
- percent of population
- 96.5% (2014 est.)
- total
- 316,400
Radio broadcast stations
AM 3, FM about 70, shortwave 1 (2008)
Telephone system
- domestic
- liberalization of the telecommunications sector beginning in the late 1990s has led to increased competition especially in the mobile services segment of the market
- general assessment
- telecommunications infrastructure is modern and fully digitized, with satellite-earth stations, fiber-optic cables, and an extensive broadband network
- international
- country code - 354; the CANTAT-3 and FARICE-1 submarine cable systems provide connectivity to Canada, the Faroe Islands, UK, Denmark, and Germany; a planned new section of the Hibernia-Atlantic submarine cable will provide additional connectivity to Canada, US, and Ireland; satellite earth stations - 2 Intelsat (Atlantic Ocean), 1 Inmarsat (Atlantic and Indian Ocean regions); note - Iceland shares the Inmarsat earth station with the other Nordic countries (Denmark, Finland, Norway, and Sweden) (2011)
Telephones - fixed lines
- subscriptions per 100 inhabitants
- 52 (2014 est.)
- total subscriptions
- 170,000
Telephones - mobile cellular
- subscriptions per 100 inhabitants
- 113 (2014 est.)
- total
- 370,000
Television broadcast stations
14 (plus 156 repeaters) (1997)
Transportation
Airports
96 (2013)
Airports - with paved runways
- 1,524 to 2,437 m
- 3
- 914 to 1,523 m
- 3 (2013)
- over 3,047 m
- 1
- total
- 7
Airports - with unpaved runways
- 60 (2013)
- 1,524 to 2,437 m
- 3
- 914 to 1,523 m
- 26
- total
- 89
Merchant marine
- by type
- passenger/cargo 2
- registered in other countries
- 19 (Antigua and Barbuda 10, Belize 1, Faroe Islands 4, Finland 1, Gibraltar 1, Norway 2) (2010)
- total
- 2
Ports and terminals
- major seaport(s)
- Grundartangi, Hafnarfjordur, Reykjavik
Roadways
- paved/oiled gravel
- 4,782 km (excludes urban roads)
- total
- 12,890 km
- unpaved
- 8,108 km (2012)
Military and Security
Manpower available for military service
- males age 16-49
- 75,337 (2010 est.)
Manpower fit for military service
- females age 16-49
- 61,511 (2010 est.)
- males age 16-49
- 62,781
Manpower reaching militarily significant age annually
- female
- 2,200 (2010 est.)
- male
- 2,277
Military - note
Iceland is the only NATO member that has no standing military force; all US military forces in Iceland were withdrawn as of October 2006; defense of Iceland remains a NATO commitment and NATO maintains an air policing presence in Icelandic airspace; Iceland participates in international peacekeeping missions with the civilian-manned Icelandic Crisis Response Unit (ICRU)
Military branches
no regular military forces; Icelandic National Police; Icelandic Coast Guard (2013)
Military expenditures
- 0.13% of GDP (2012)
- 0.14% of GDP (2011)
- 0.13% of GDP (2010)
Transnational Issues
Disputes - international
Iceland, the UK, and Ireland dispute Denmark's claim that the Faroe Islands' continental shelf extends beyond 200 nm; the European Free Trade Association Surveillance Authority filed a suit against Iceland, claiming the country violated the European Economic Area agreement in failing to pay minimum compensation to Icesave depositors
Refugees and internally displaced persons
- stateless persons
- 119 (2014)